Introducing 2019.2: vector maps, parameter actions, and more
Tableau 2019.2 offers new features that help bring your data stories to life. With vector maps, your mapping experience will feel smoother and look sharper as you pan and zoom to explore your geospatial data. Parameter actions unlock your analytical creativity, by allowing viewers of your vizzes to change parameter values through mouse selection. Show or hide containers to maximize dashboard real estate. All of these features available for free with Tableau Desktop Public Edition 2019.2!
Your spatial data never looked so good
Thanks to the implementation of vector maps, the pan and zoom experience is smoother than ever before. Maps will scale seamlessly when zooming in and out. In the example below using New York CitiBike data, zooming in to a specific area shows more detail such as street names and points of interest.
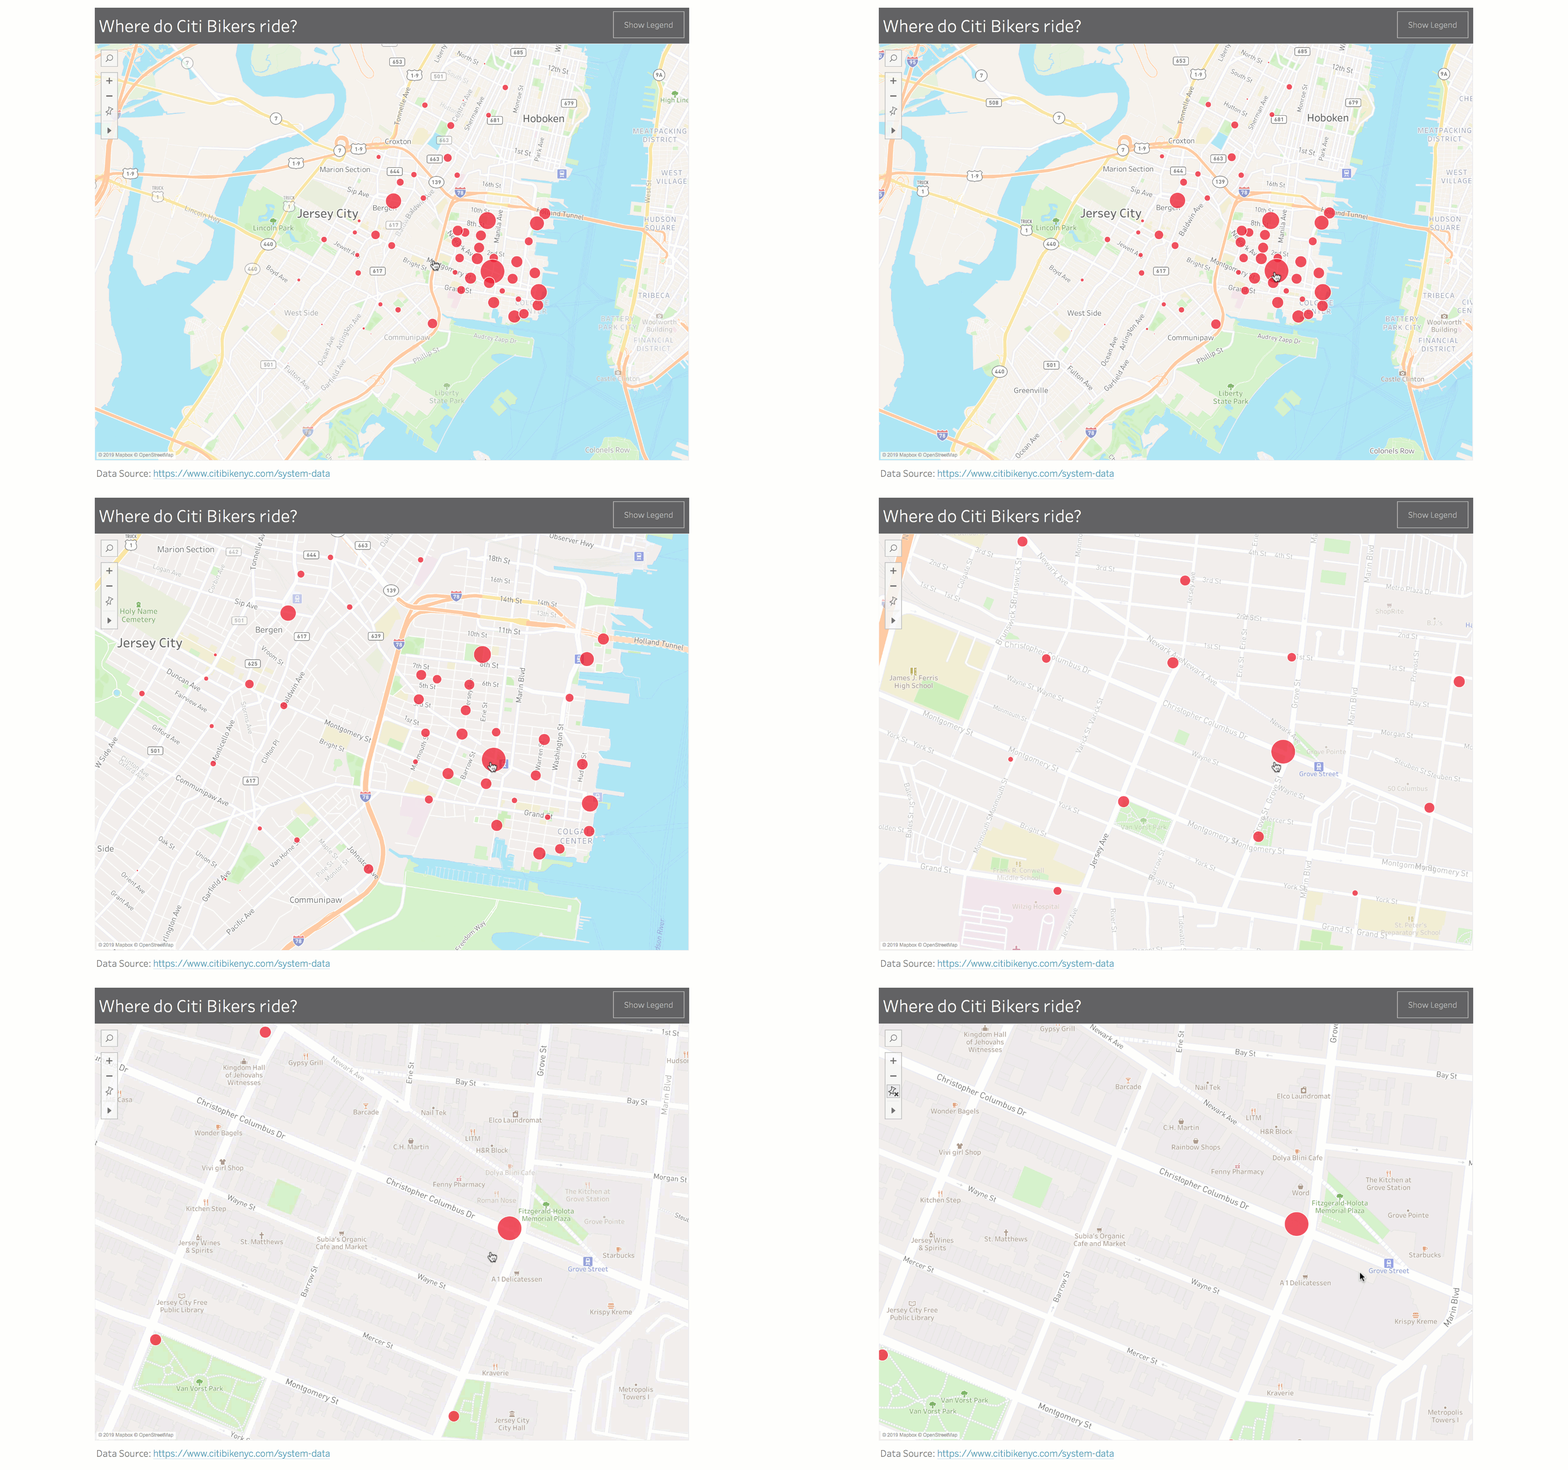
2019.2 also comes with additional default map styles and layers. In addition to Light, Dark, and Normal styles, we’ve added Satellite, Outdoors, and Streets. To customize a map from any of the default styles, you can toggle specific map layers. We’ve added Points of Interest, Neighborhoods, Subway and Train Stations, and more. In the example below, the map uses the new default ‘Streets’ style, including the new data layer that shows points of interest near more popular CitiBike stations.
Instructions on how to customize maps in Tableau can be found here.
Bring interactivity to your data stories like never before
You can now visually change a parameter’s value. It’s a simple but powerful tool. By interacting with marks on a viz, you can drive reference lines, calculations, and filters. Zen Master Joshua Milligan walks through an example of how to use parameter actions to highlight multiple points on a line chart in this blog post. (Spoiler alert: he even makes interactive minesweeper in Tableau!)

Making your dashboard authoring experience easier
With Tableau 2019.2 we’ve added a number of highly requested authoring features. You can now toggle between “visible” or “hidden” for any floating container on your dashboard. In this blog post, Marc Reid shows how this feature can be used to create a help screen toggle for your dashboard.
You can now customize reference line tooltips text or choose to disable the tooltip altogether.
Go ahead, give it a try! We’ll be curating a gallery of vizzes created by Tableau Public authors around the world using these new features. Want yours to be included? Follow these steps:
- Create a viz using any of the features listed above.
- Save it to Tableau Public
- Share a link to your viz on Twitter and tag @tableaupublic. If your viz includes a vector map or parameter actions, join the conversation by using these hashtags:
If you don’t have Twitter, you can email a link to us at public@tableau.com.
Autres sujets pertinents
Abonnez-vous à notre blog
Recevez toute l'actualité de Tableau.


