"Living" Dashboards: How to automate your data with Google Sheets


Jacob Olsufka is a Senior Visual Analytics Consultant at Decisive Data, a data analytics and visualization company based out of Seattle, Washington. He's sharing how he leverages Google Sheets to automate data collection, later visualized in Tableau.
In most Tableau Public visualizations, you see Tableau’s power to provide an interactive way to analyze data or tell a story, but are static in nature. You publish once, the data never updates, and that data story never changes. If there is the chance for a visual to be updated with fresh and new data every day, week, or month, then this can bring it to life. Every time you open the dashboard there is the opportunity for new insights, trends and stories to be uncovered. This power of automation is something that happens all the time in business, but not as often in our casual Tableau work. The manual processes often involved is a struggle I’m sure many of you share with me.
Enter, the google sheets connection. Up until recently, this was a feature that I had not tried, and had heard whispers about but not seen used much. I figure there are many more out there that are in a similar situation, so I want to share my experiences learning about and using it, and encourage others out there to take advantage of this great feature as well.
One of my favorite dashboards that I created last year is my Home Run Tracker. This dashboard shows every home run throughout the MLB season, merging home run data from hittrackeronline.com with pitch details from MLB’s PITCHf/x data. Since home runs are hit every day, I wanted it to be updated as frequently as I could. Every morning of last season I would have to run several manual steps, culminating with me re-publishing the dashboard to Tableau Public and hoping I didn’t screw something up. My ultimate dream was to have this whole process automated. Working with several awesome co-workers at Decisive Data, we were able to make that happen this season. The cherry on top, making this all possible, is Google Sheets and its daily refresh capabilities in Tableau Public.
Manual process before automation:
- Manually run several python scripts to load the data into Snowflake
- Manually run several SQL scripts in Snowflake to prep the data
- Manually refresh the data in Tableau
- Manually republish to Tableau Public
Manual process after automation:
- Nothing! Just opening the dashboard up to make sure the latest day has been loaded.
Here is a peek inside of how we made the whole process automated. We load the latest raw hittrackeronline.com and MLB’s PITCHf/x data into a Snowflake database using scripts running inside an Azure Logic App. The data is then staged by using Alteryx Scheduler and a series of Alteryx Workflows to kick off Snowflake SQL commands to prep the data. The prepped data is then loaded into Google Sheets using the Alteryx Google Sheets Output Tool. Finally, Tableau Public refreshes the Google Sheets data source once a day. No manual work needed! Special thanks to Micah Parker, Jacob Koestenick, Darren Gardner and Michael Hallak from Decisive Data for all their help.
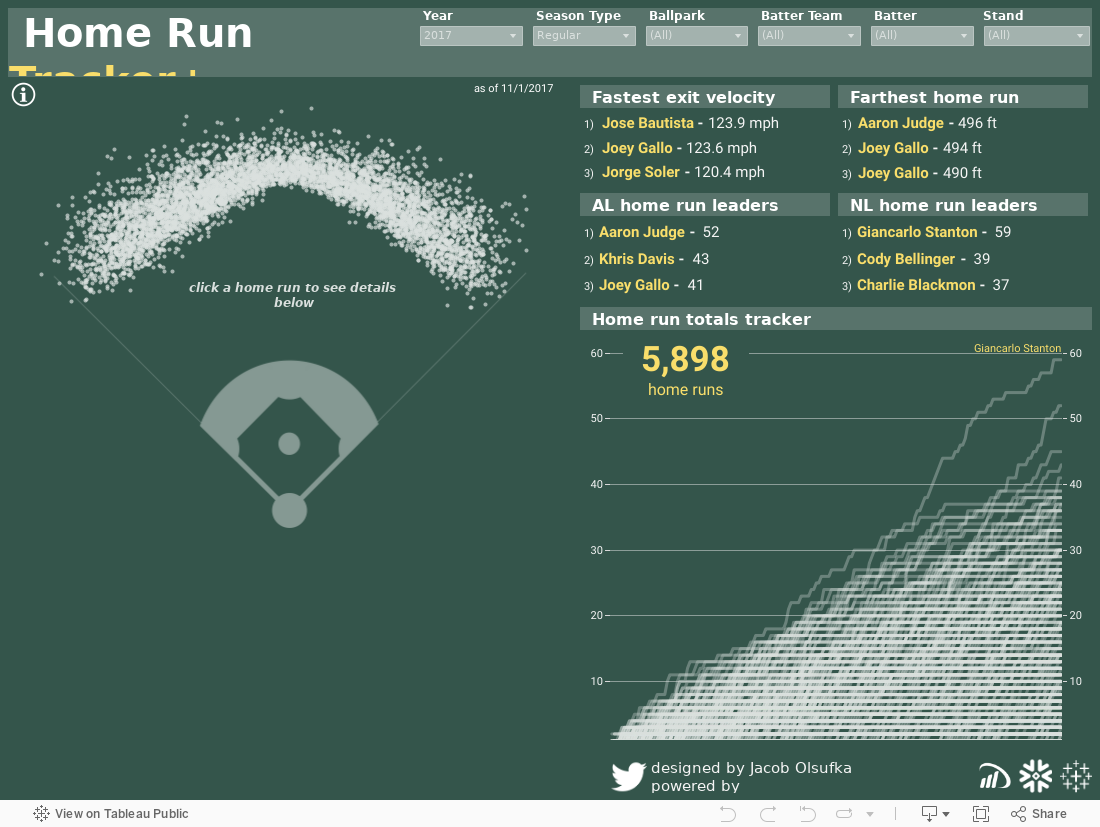
My favorite part of this dashboard is it has an action to watch the video for every single home run. Have fun playing around with it! Follow along daily throughout the playoffs to see who ends up with the most HRs.
If you are using a tool like Alteryx to bring data in Google Sheets note that it has a 2 million cell limit. If your data source exceeds that, you could split your stream into multiple Google Sheets and then union in Tableau. Alternatively, to cheat this limit you can concatenate multiple columns together, and then split them back out in Tableau by using Split or Custom Split in the Data Prep window.
Examples:
Here are a few other great examples of automatically refreshing dashboards on Tableau Public.
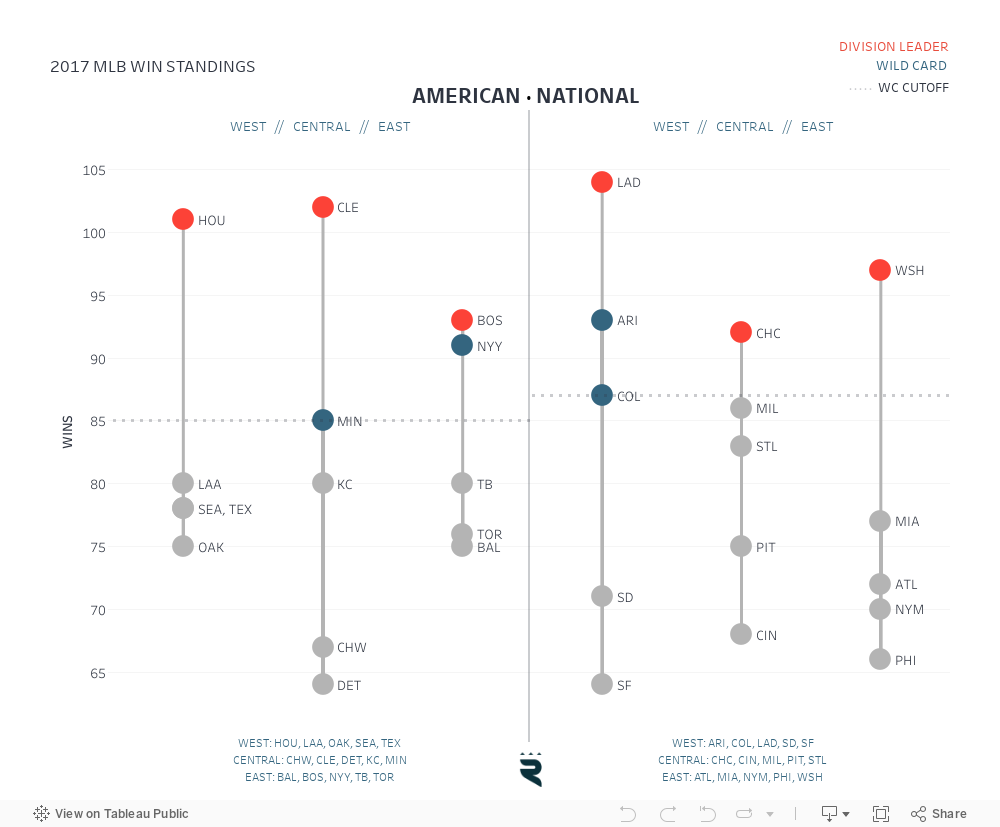
Ryan Sleeper created a simple but effective way to visualize MLB standings.
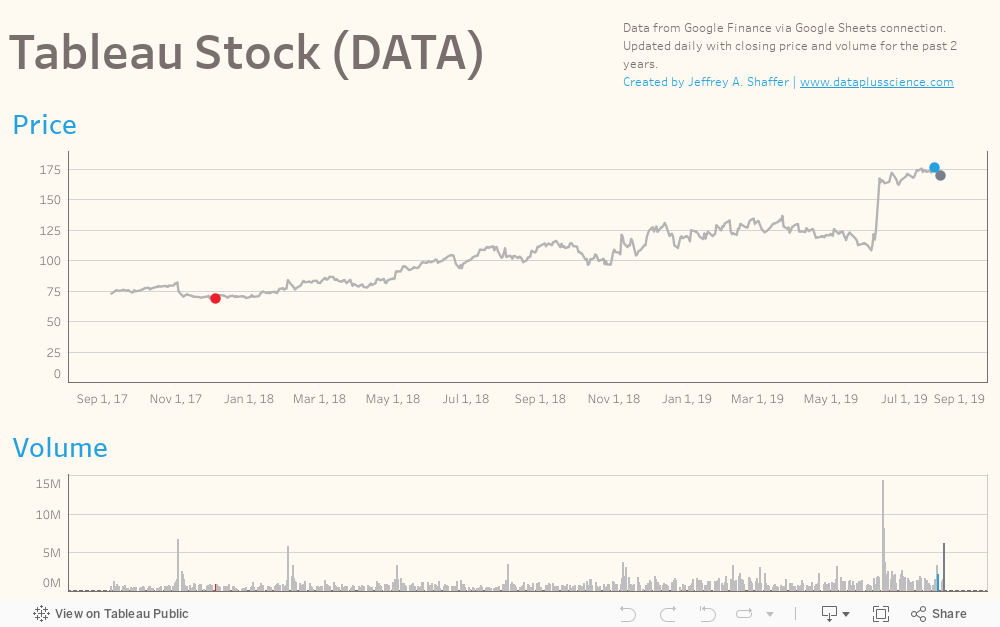
Jeffery Shaffer's dashboard has been tracking Tableau Stock ($DATA) Price and Volume for the last year.
Check out even more examples:
- Ken Flerage collects stats on his Tableau Public profile views - see here.
- The DataDuo, Adam Crahen and Pooja Gandhi have an updating dashboard that uses a Google Form as the data source. Vote in their latest #DuoDare data project here.
- Perfect for tracking what people are saying about #data17 – Suraj Shah uses an IFTTT Twitter applet in this auto updating dashboard.
- Steve Fenn keeps an updated list of MLS Rosters here.
Even if you are using Google Sheets, you will still need to get your data itself to update, usually by scraping the web. If you are looking to start a project of your own – here are a few helpful resources to get started:
- Tableau Tip: Connect to Google Sheets with Daily Auto-Refresh by Andy Kriebel
- Connecting Google Sheets with Tableau 10 by Jeffery Shaffer
- Web Scraping for Everybody by Florian Ramseger
Fun automation projects like these don’t have to involve a fancy or expensive business setup, and they don't have to be for your job with day-to-day data analytics. They can be on your own too! If you haven’t already, try taking advantage of this great feature of Tableau and Tableau Public to turn your static dashboards into ‘living’ dashboards.
Autres sujets pertinents

Meet Iron Viz 2024 Finalist Jessica Moon
 15 avril, 2024

Meet Iron Viz 2024 Finalist Pata Gogová
8 avril, 2024

Student to BI Analyst, How Tableau Can Lead to a Successful Data Career
 20 mars, 2024
Abonnez-vous à notre blog
Recevez toute l'actualité de Tableau.