How and why I learned Tableau as a student


The following is a guest post by Corey Jones, recent graduate of Saint Joseph’s University, Tableau Public Ambassador, and active member of the Tableau Community.
I was first introduced to Tableau in one of my business intelligence classes at Saint Joseph’s University. During my senior year, my passion for data analytics grew, especially during my co-op at Johnson & Johnson. I was given the opportunity to develop dashboards for my team. The exposure to Tableau showed the power of communicating effectively with data.
I had never taken formal Tableau training. But the global Tableau community is filled with data leaders I continue to learn from every day. Here’s how and why I learned Tableau as a student:
1. Create a Tableau Public profile.
Data visualization takes practice. As you practice, I encourage you to publish your work to Tableau Public. As you continue to hone your skills in the Tableau Public community and publish more vizzes, you will be simultaneously creating an online portfolio of your work.
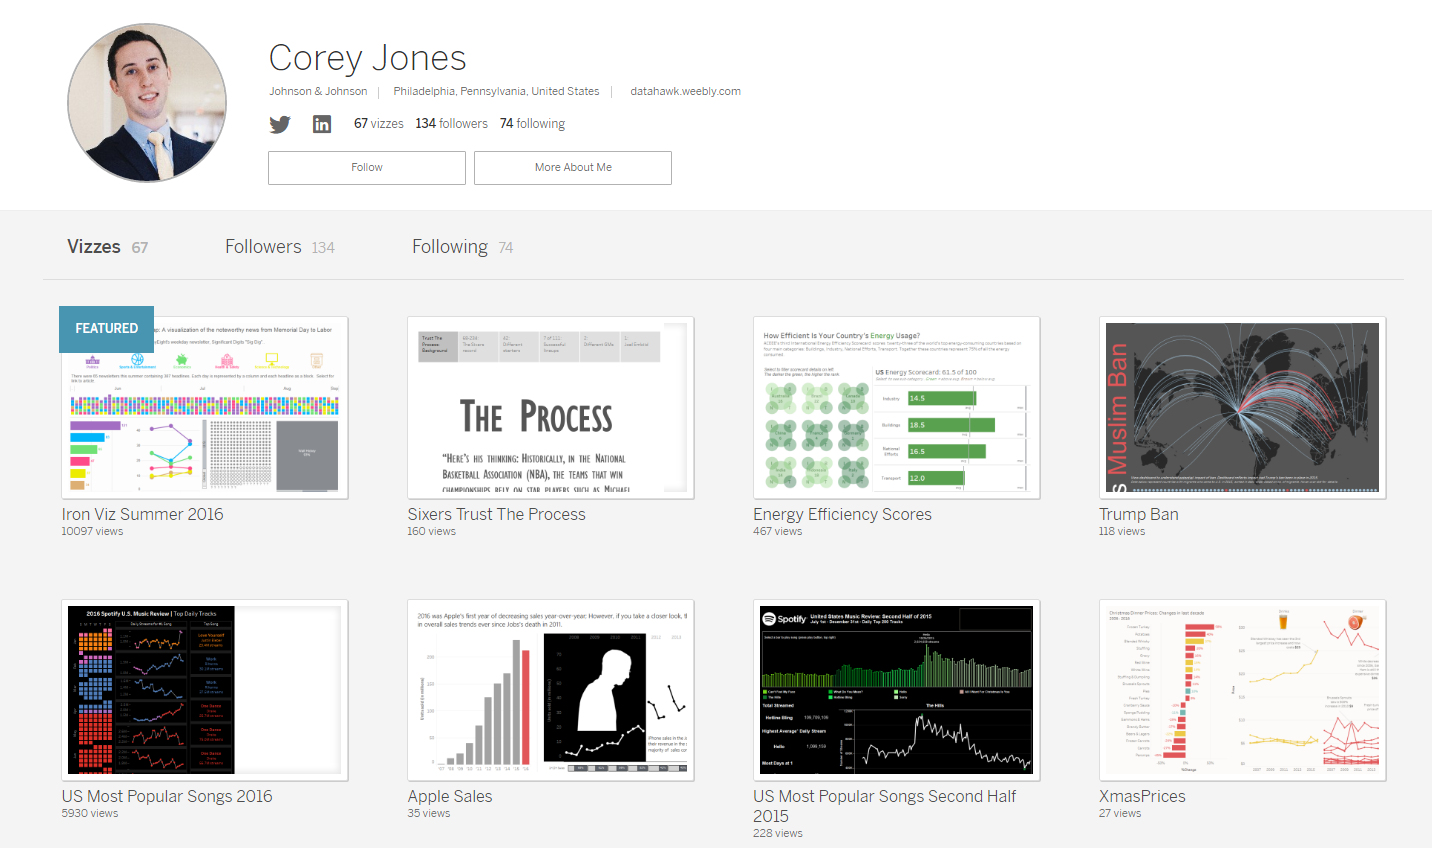
This portfolio will become incredibly valuable when you are looking for your first (or next) job. Josh Tapley, Director of Data Visualization at Comcast says, “A public portfolio has become the most critical part of our hiring process. It gives us a much better perspective regarding technical skills, creativity and design aesthetic than we can determine through a resume alone.”
2. Discover your passion.
Whatever your passion is, there is data out there for you to discover.
I challenge you to look every day at Tableau Public’s page for one month. I often gain inspiration and learn new techniques through this process. In my Role of Politics and Economy on Health Care Insurance dashboard, you can see clear examples of influence from the community.
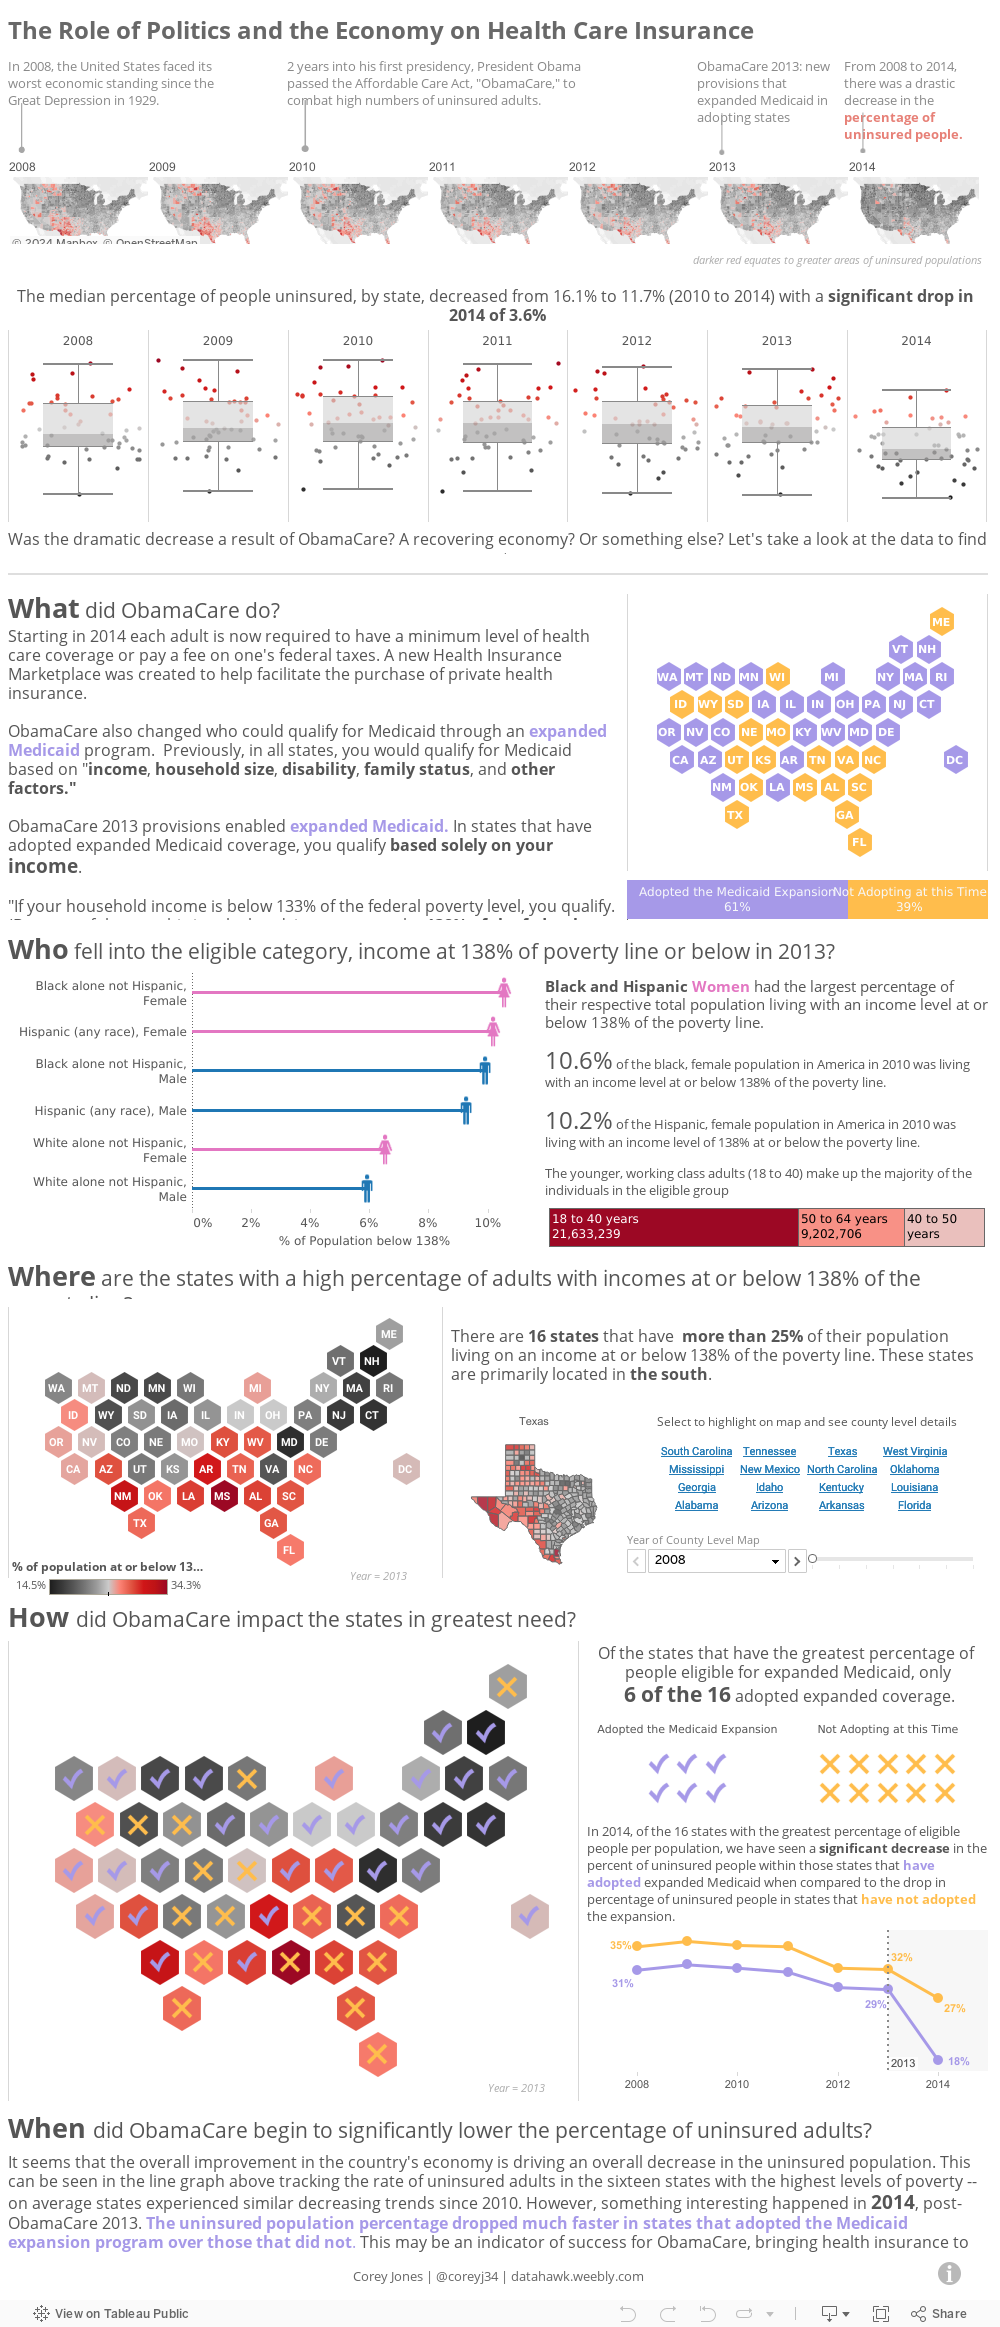
I was first exposed to small multiples through Shine Pulikathara’s NFL 2015 Regular Season viz. The design for the hex maps was a technique learned from Matt Chambers and seen in his The Gun Problem We Don’t Mention viz.
Find one viz a day that interests you. Download their Tableau workbook and reverse engineer how visuals were constructed and examine the back end formatting choices the author made.
3. Get involved in the community.
My biggest recommendation for anyone, regardless of skill level, is to participate in #MakeoverMonday.
Here’s how it works: An interesting data set is provided to you, you then create a viz based on this data to tell a story clearer than the original, and publish it to Tableau Public. You are immediately connected with individuals who participate in the #MakeoverMonday exercise.
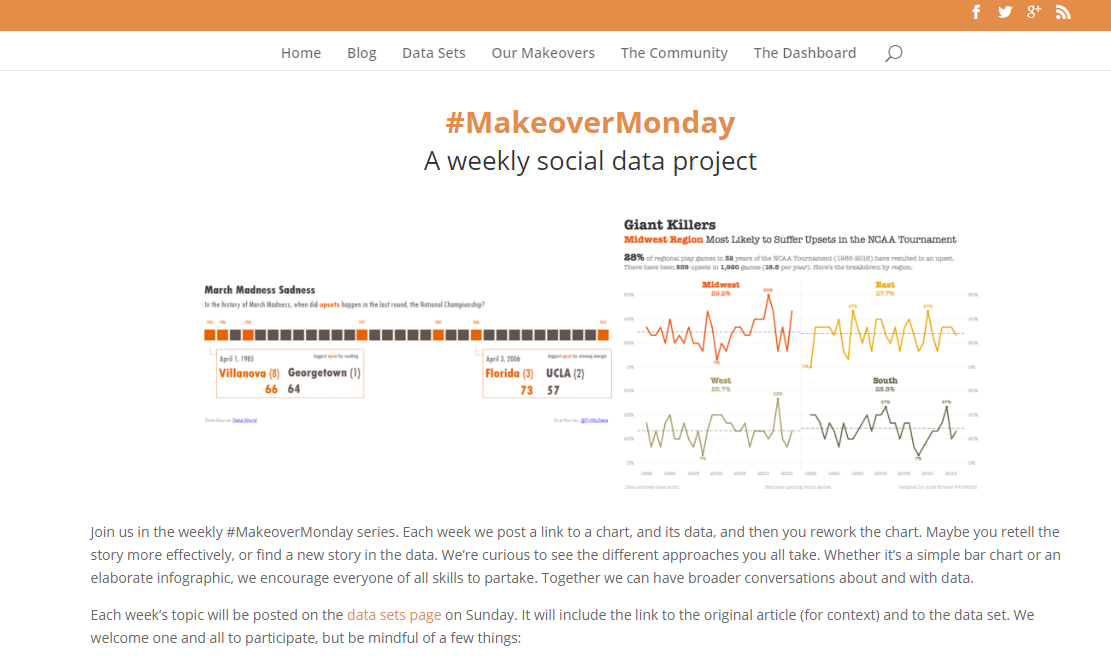
You can get instant feedback and see different visual approaches to the same data set.
Also, check out if your city has a Tableau User Group. They are a great way to meet new people and hear how others are using Tableau!
Next Steps
Business leaders are recruiting new skill sets. Allison Kopec, J&J Finance Director says, “There is so much value in data, however in order to make it useful for decision makers, it needs to be translated - first in terms of insights, second in terms of framing. Both are critically important activities and those individuals who can do both well will be in high demand across many industries”.
The future of data viz should excite you. I am in a finance program at Johnson & Johnson, not data science or IT. Tableau allows me to communicate better with members of various business functions. I thank the massive, global Tableau community for teaching me how to effectively showcase my data skills with Tableau Public.
Are you a student?
Request your student license and create a Tableau Public profile today.
Abonnez-vous à notre blog
Recevez toute l'actualité de Tableau.