5 Tips to Cure Your Data-Cleaning Headaches


The following is a guest post by Tableau Public author Nicolás Iguchi.
"I have nothing to offer but blood, toil, tears, and sweat."
How many times have you looked for that silver-bullet tool to solve all the data-quality issues we encounter in almost every data set? I’ve already lost count, and despite searching for years, I have not found it anywhere.
I stopped looking for it when I finally understood that data preparation is like the work that a gardener has to do before the flowers bloom. It’s necessary to prepare the ground, plant the seeds, add nutrients, remove weeds, ensure that the plant receives the correct amount of water and sun, and so on. All these tasks require a lot of time and effort, and no one regales about them once spring arrives, but they are critical to getting the most beautiful flower.

You can ask any gardener about the demands of preparing one's garden.
The same situation applies for data vizzes. We need to give our best effort in the data-preparation process to create a meaningful story, even if it consumes our time.
I have a few helpful data-cleaning tips that I believe can help you as well:
1. Get Involved With Your Data
Before thinking of the way to communicate your story, take some time to understand the nature of your data and the business rules that support it. It’s not only about taking a look at the header line and the first rows. It’s about getting deeply involved in the content of the data, trying to understand what they represent and how they do it. Some things that should be reviewed in this stage are:
- Data types: Do data types correspond to the values that are actually stored? If they don’t, how can you fix this gap?
- Values each column can take: Are they within the expected range (eg, are temperatures between -15°C and 60 °C)? If they aren’t, what may these out-of-range values express?
- Empty and NULL values: If these exist, what may they represent for each case? An empty value could have a very important meaning in a data set.
- Initial patterns in the data: Is there any superficial pattern you can spot?
This process will help identify the types of data-cleaning tasks your data set needs.
2. Never, Ever Trust Your Data at First Sight
In general, the first rows of any data set are always pretty and well-formatted, which makes us unconsciously think that we won’t have to deal with data quality issues. Cheated by the 50-rows preview that every tool provides, we move forward and start thinking about the best way to start the story, only to realize that after those 50 rows, there were so many strange cases that make it impossible to do any kind of analysis.
This may happen even if the data set is generated by an important organization. In the end, every data source is created by humans or by machine-developed by humans, and can include errors or non-considered situations.
Besides, there may be some differences in the way we understand the data, making wrong assumptions (unit measures are a common case: we assume that it’s expressed in our usual unit measure, but that’s not always so).
Always suspect of the quality of the data you are analyzing, and double-check the assumptions you may have. This attitude will help you detect more issues in advance, saving a lot of time in the data preparation process. You will also develop detective skills you never imagined you had.

3. Avoid Manually Cleaning Your Data
How many times did you review a data set and think: “I can fix this manually in a couple of minutes”? It’s very tempting to just open your file in a spreadsheet and clean your data manually. It may seem like be the easiest way to perform this tedious task.
But deep inside, we all know that as humans, we tend to make mistakes when performing repetitive tasks. It may also happen that, after getting the first insights, we find some inconsistencies that require us to start over the cleaning process. If we did our cleaning process manually for every iteration, these “couple of minutes” could easily turn into several hours of work.
Whenever it’s possible, use a software tool to clean your data. Tableau Data Interpreter is an excellent help in the cleaning process, and you can also use groupings and calculated fields to help you.
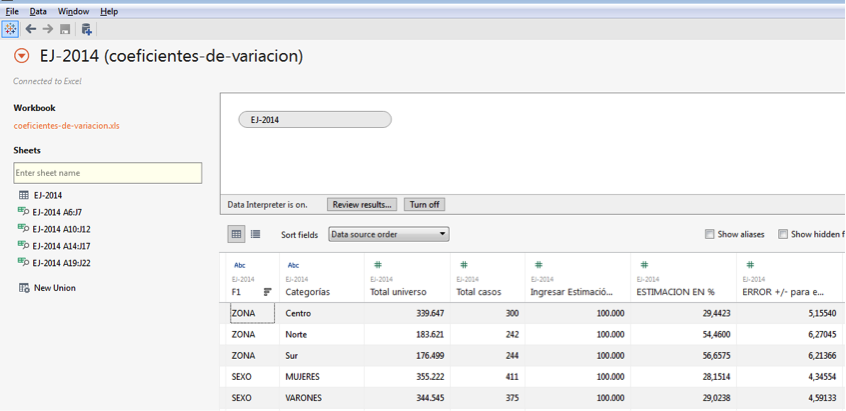
Tableau Data Interpreter is your friend!
4. Standardize Your Data
Standards are a constraint for creativity, but in data preparation they accelerate our understanding of the data we are reviewing, especially when dealing with multiple data sets.
Change the column headers to some that make more sense to you, and follow the same naming convention across all the data sets you use. If the same column appears in various data sets, use the same name for this column, so that you remember they are related.
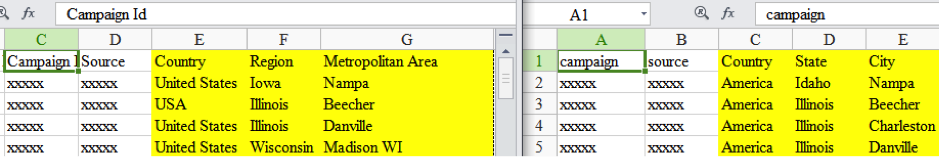
Without standards, it’s not so obvious that these data sets are equivalent.
Create standards over your data values as well. That way, you can get the data you need by taking only a few fields and applying the simple filters. Here are some things to consider when you standardize your data set:
- In Dimensions, group those elements that we know are equal but machines can’t detect (for example, we know that NYC and New York refer to the same city, but many software tools are unable to do so). Base your analysis on these new standard dimensions.
- Create new Dimension fields to group those values that need to be analyzed together, letting you filter and focus on them without applying complex rules every time.
- Keep only one field per measure, if for any case you only need to take a subset of it you can always filter the dataset in the canvas.
- Use the same unit for all your measures, so that you can aggregate them without worrying about conversions.
5. Iterate Your Data-Cleaning Process
Iteration is the best (and maybe the only) way to reach perfection.
Instead of trying to fix all your data sources in a row, focus on those issues that block you from performing any kind of analysis. Once the initial cleaning is done, start filling Tableau’s canvas with your first ideas. Based on these insights, you’ll be able to determine which data quality issues need to be corrected first. With every iteration, you’ll find new data-quality issues that you can then tackle in the next iteration.
When is it best to stop iterating? When you feel comfortable with the story.
These tips are not hard-and-fast rules that must be strictly followed. I can’t either guarantee you that you’ll be able to dominate every data set with them either, but I’m pretty sure that at least you’ll find data-cleaning process more manageable, and you may even start enjoying it as well!

Ready to iterate your data-cleaning process?
Nicolas is a Business Intelligence Designer at Globant’s Big Data Studio and Business Intelligence Teacher Assistant at UTN University in Buenos Aires, Argentina. You can contact him on Twitter @ntigc.
Autres sujets pertinents

Meet Iron Viz 2024 Finalist Jessica Moon
 15 avril, 2024

Meet Iron Viz 2024 Finalist Pata Gogová
8 avril, 2024

Student to BI Analyst, How Tableau Can Lead to a Successful Data Career
 20 mars, 2024
Abonnez-vous à notre blog
Recevez toute l'actualité de Tableau.