Roundup of Tableau Public's Data in the Wild Sources


February is #DataInTheWild month at Tableau Public. In today's digital world, data really is all around us. These days when you walk down the street to buy milk from the grocery store, you generate data with your fitbit. When you fall asleep after a long day at work, you generate data through the Sleep Cycle app on your iPhone. When you listen to music you generate data through Spotify. But with all this data out there - "In the Wild" - where should people go to access it? This is a question the Tableau Public team fields all the time, so we thought it would be useful to our community of authors if each of us shared one of our favorite places to go find data on the internet.
What follows is Tableau Public's roundup of our favorite places to find Data in the Wild.
Andrew is a fan of researching scientific data, especially when it pertains to his favorite foodgroup
"Scientists generate enormous amounts of research data on any given single topic. Luckily, other scientists often sift through and compile this research data into a single database. In the United States, if the research was funded by public grants, these databases are often available to download by the public.
Before I worked for Tableau, I was interested in visualising the mercury content of popular seafood species. Searching for "mercury seafood database" brought me to Stony Brook University's seafood mercury database, a dataset that contains average mercury concentrations for approximately 1633 seafood samples.
With some additional manual data entry of Seafood Watch sustainability ratings, country codes, and trophic levels, my very first dashboard was born:

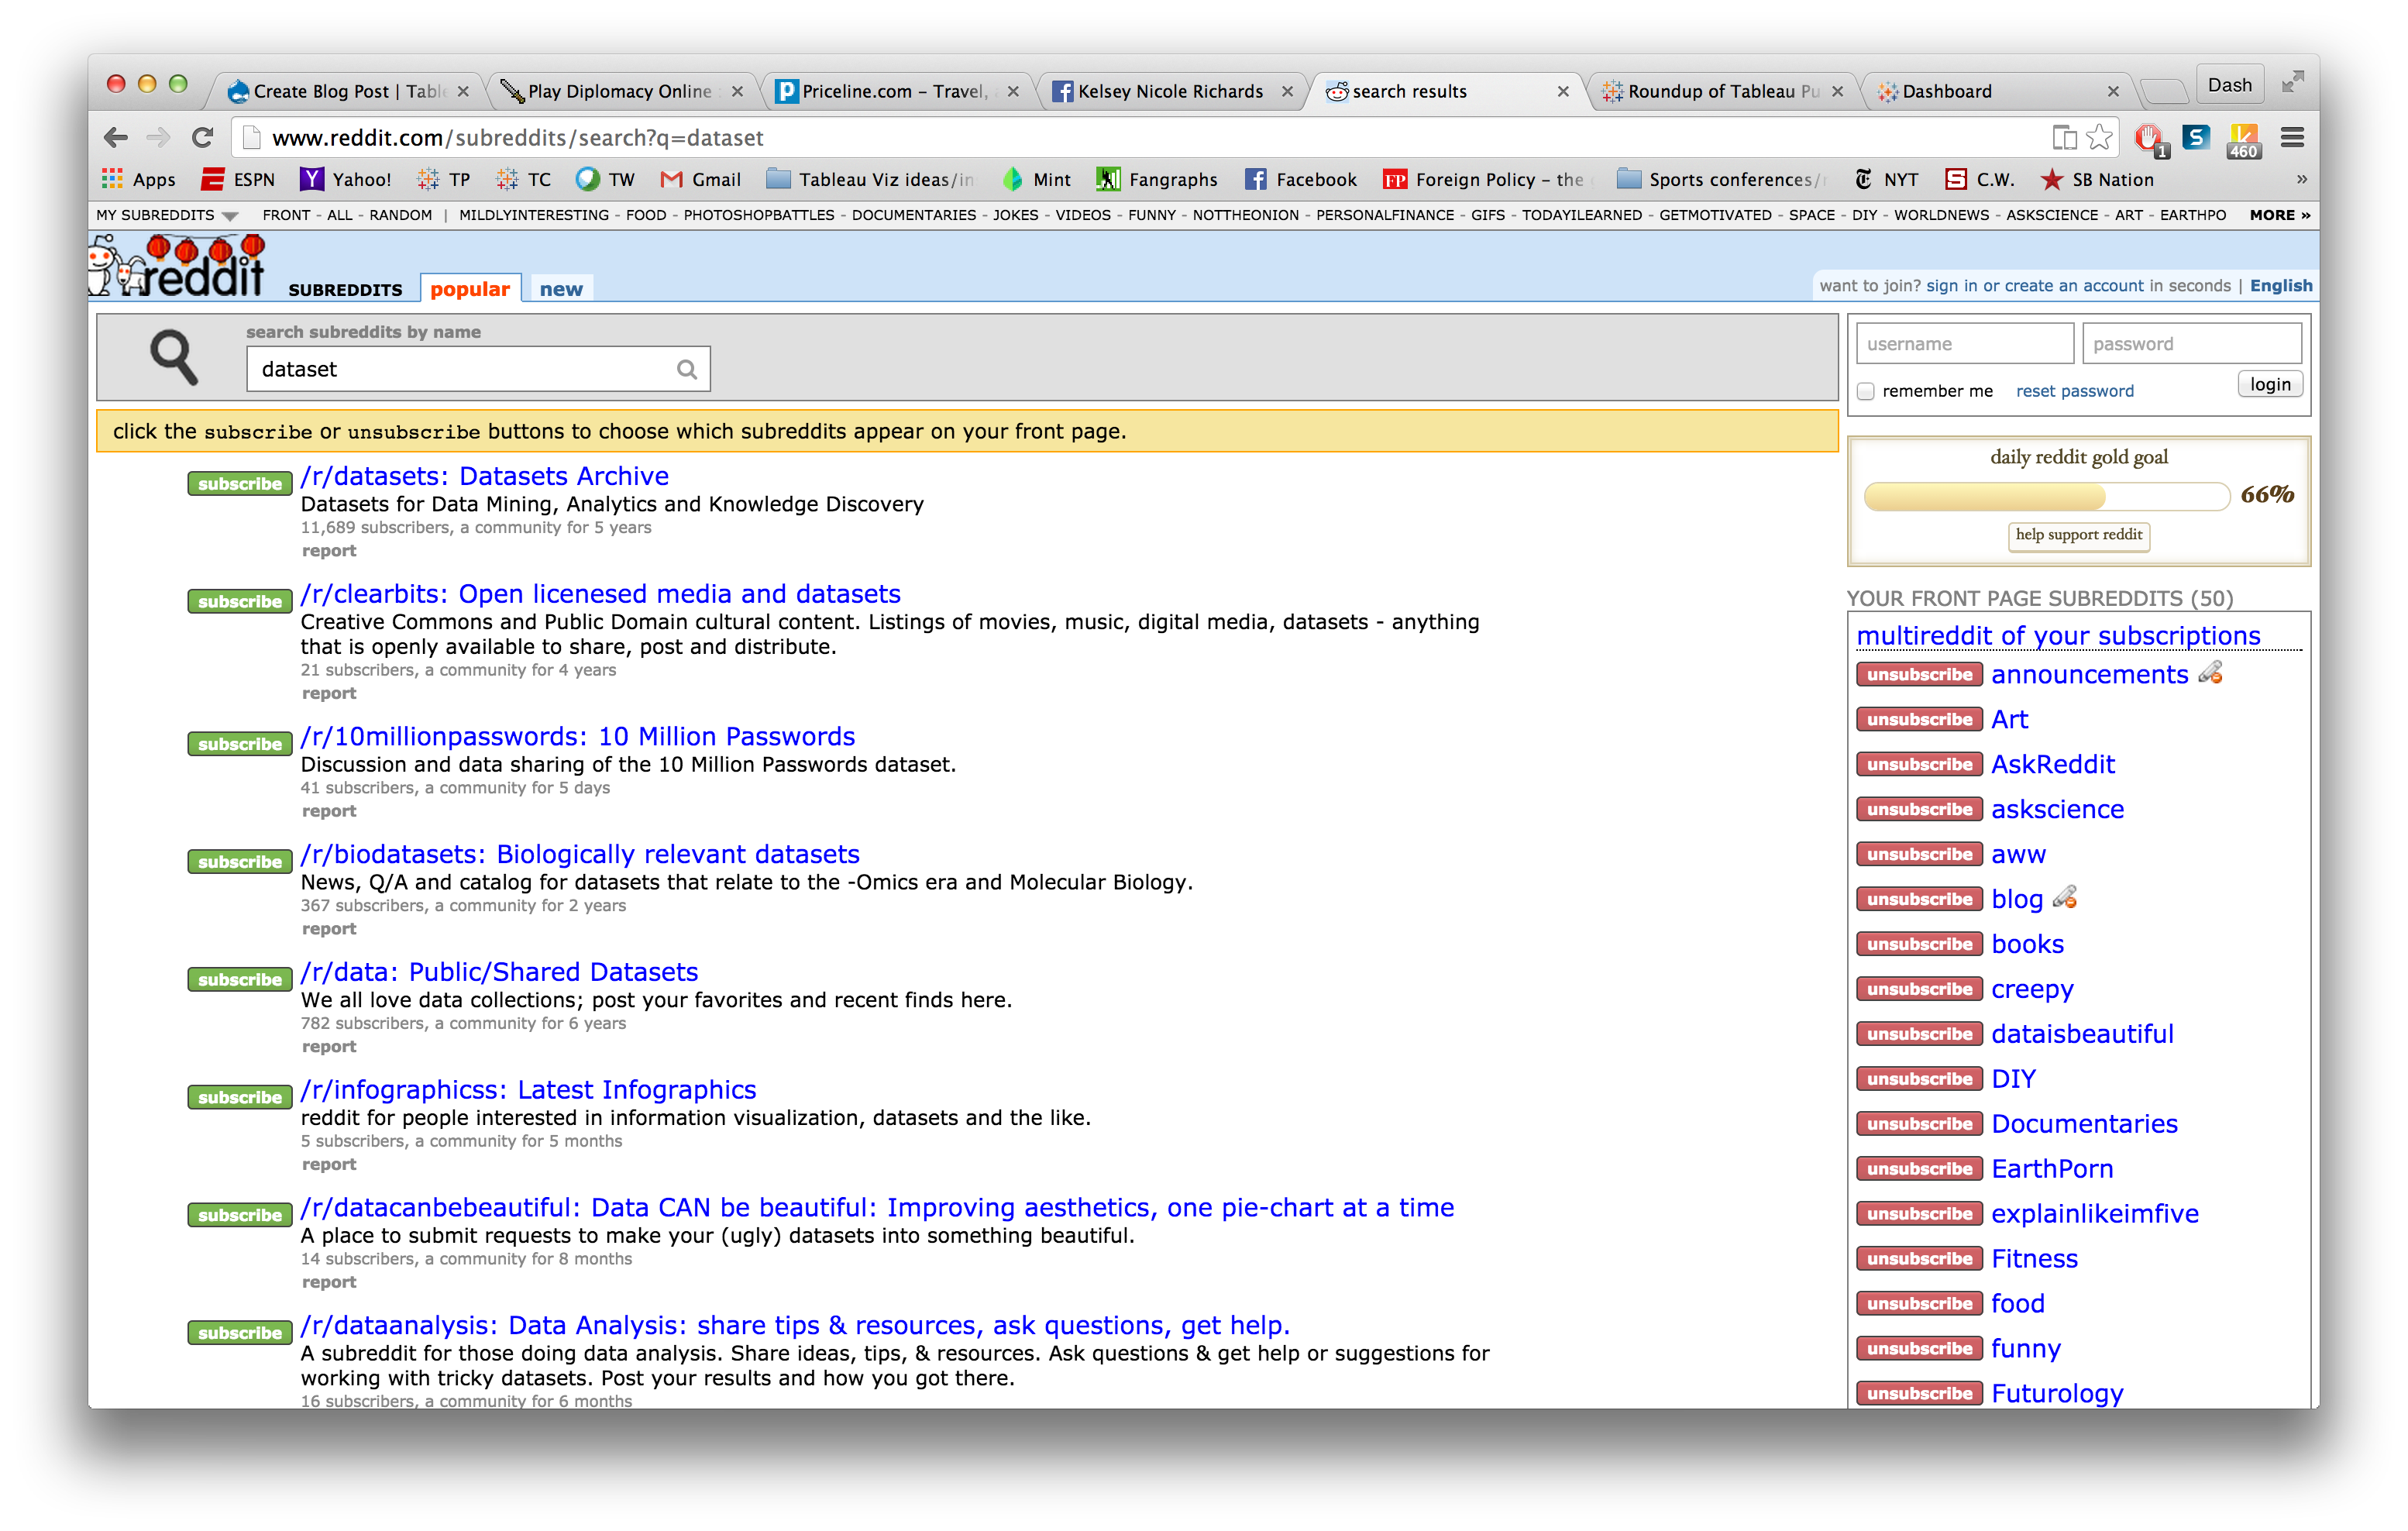
Jewel likes to go to her favorite website - Reddit - to find Data in the Wild
“I know that I already talk about it way too much, but I really freaking love Reddit. There’s all kinds of cool insights you can make about the communities of Reddit by scraping posts and analyzing karma and word frequencies in titles. There’s also subreddits where people are making their own data like /r/samplesize Not to mention, there’s a whole community dedicated to sharing data and helping people find what they are looking for, aptly named /r/datasets. ”
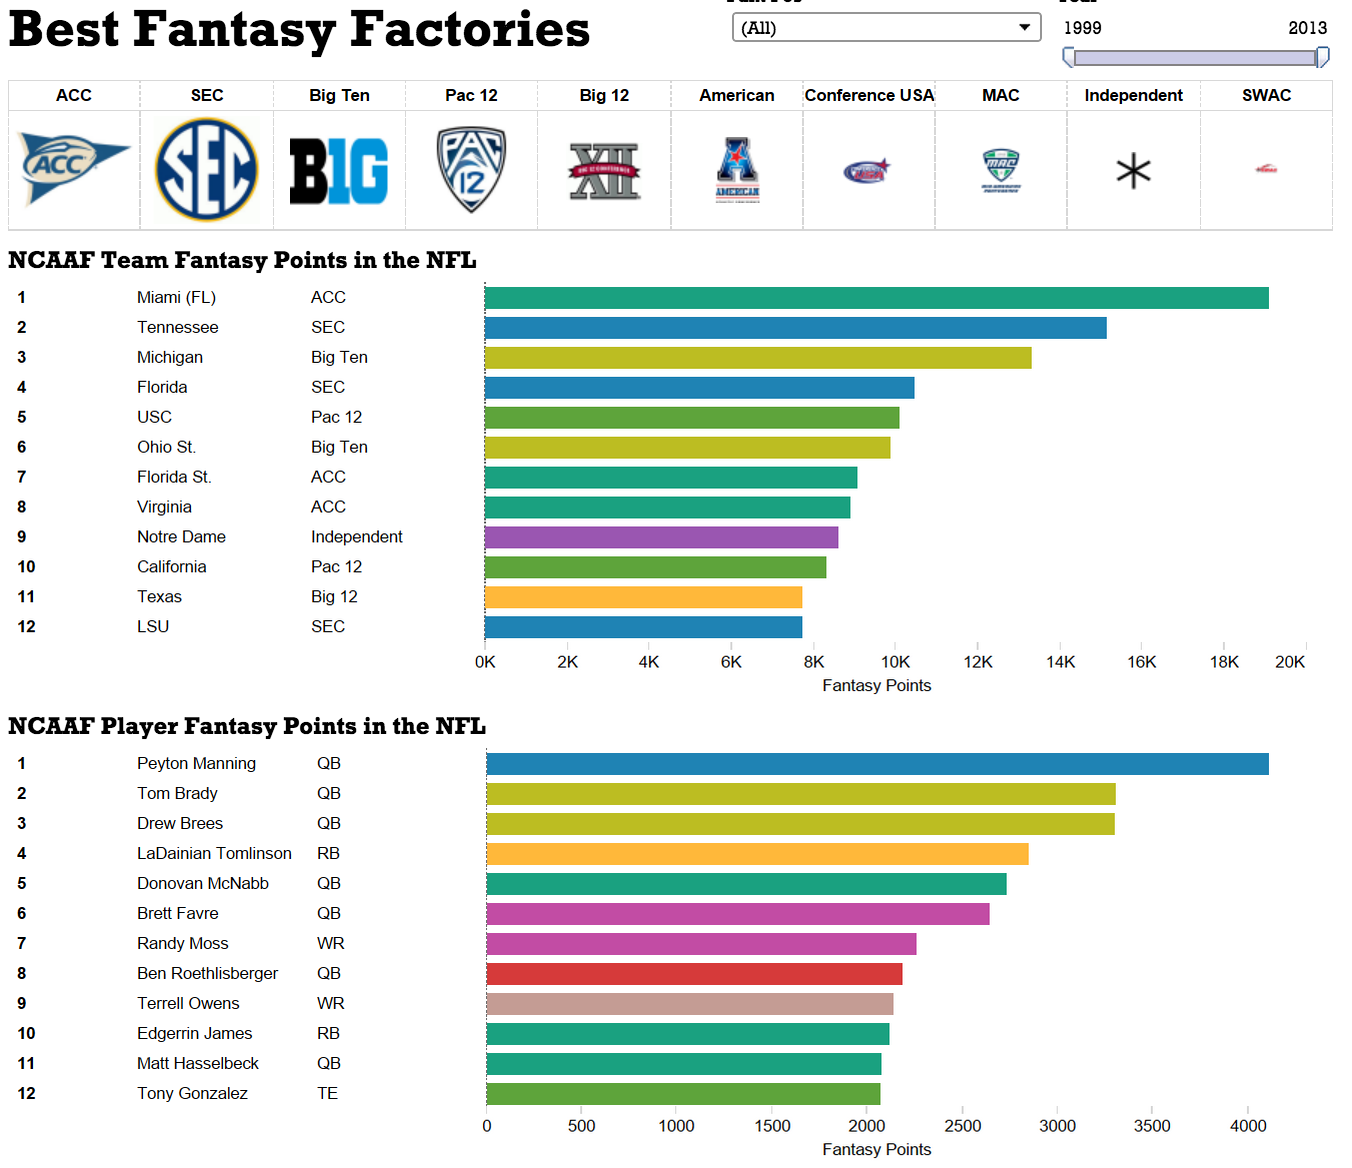
Dash chose a repository of sports statistics, Pro-Football-Reference.com
"I love sports. Oftentimes, when I'm sitting around thinking of what I would like to analyze in my next Tableau Public viz, I reflexively think of sports questions that I want to answer. There are just so many of them out there that require data exploration! This was my line of thinking in the fall, when I was transfixed by the college football and NFL seasons that had just gotten underway. I wanted to visualize which colleges produced the best NFL players - specifically the best fantasy football players. To do this, I needed fantasy football data, and a lot of it. Luckily for me, Pro Football Reference exists and I used a combination of an Import IO crawler and Pro Football Reference's yearly statistical leaders database to create the Tableau Public viz "Best Fantasy Football Factories".”
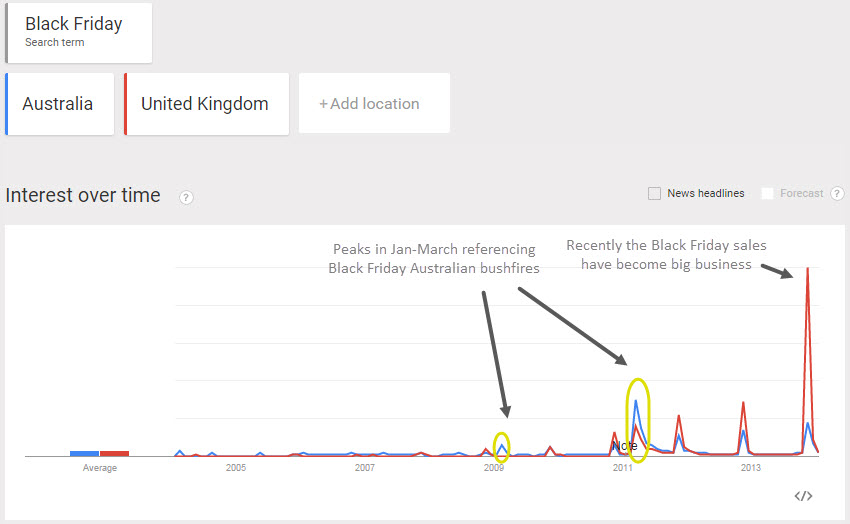
Sophie's favorite strategy is to search Google Trends
"With the saying "if it's not online it doesn't exist" becoming truer every day, what better place to see what the world is thinking than on Google Trends. Google Trends, based on Google Search, shows the how often specific keywords or topics have been queried across the globe over time. This lets you quickly identify global trends, and then export this data to a file. Brilliant!!
I used Google Tends to see the shift in the search term 'Black Friday' in Australia and the UK. Before 2011 'Black Friday' was usually associated with the devastating Australian bushfire of 1939, with people searching for the term in January-March. After 2011 'Black Friday' searches spike annually in November, in line with American post-Thanks Giving sales. This shows the start of cultural shift in both Australia and the UK (or at least that everyone likes the excuse of a sale!).
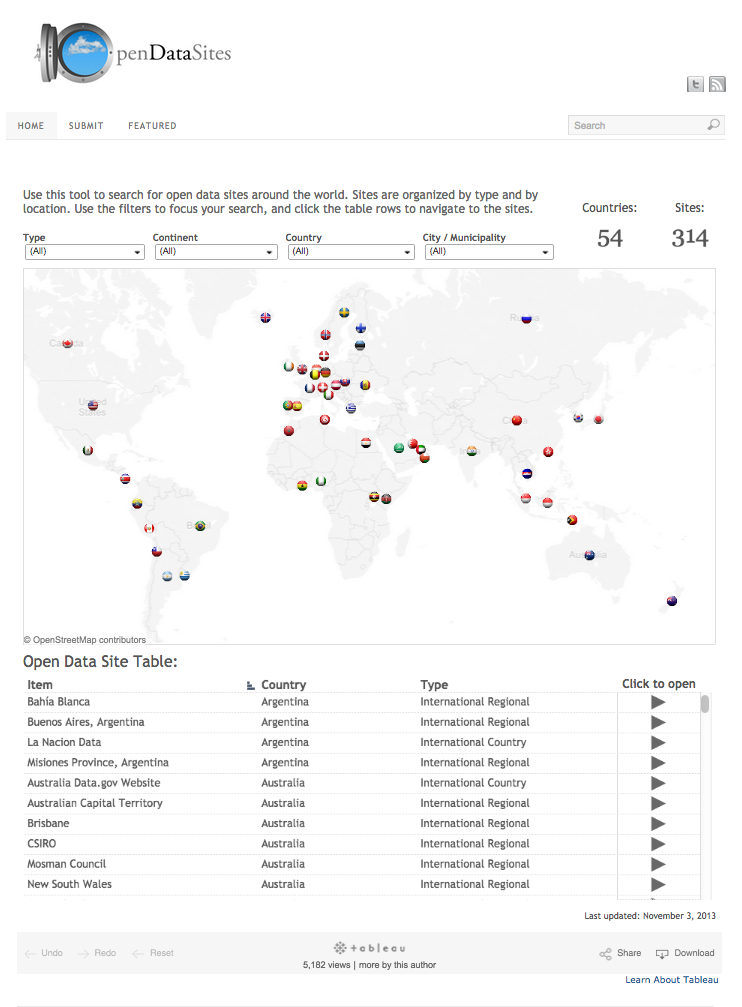
Tara prefers going to Open Data Portals to find her Data in the Wild
"A great way to find information specific to a city, region, or demographic is to look for open data portals. Simply try searching the web for “open data portal *fill in the blank here*”. I really enjoy finding data this way because it is often formatted cleanly – or as cleanly formatted as you will find on the web! Check out this site to see a starting point for exploring potential open data sites. ”
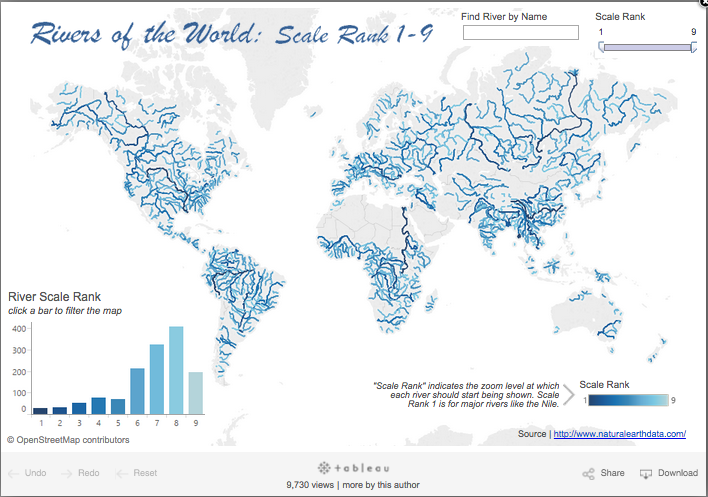
Ben uses two tools in tandem to create custom map visualizations
"I’ve recently been geeking out on maps and shapefile data using the Natural Earth Data site along with the handy “Tableau Shapefile to Polygon Converter” by Alteryx. It used to be very difficult to convert shapefiles into Tableau custom polygons and polylines, but now it’s easy. I used these two sites in tandem to create fun and interesting maps showing roads, rivers, railroads, airports, and even alternate map projections. The map showing the world's rivers is shown below.”
Let's see what you can do!
I hope that highlighting these choice data repositories will motivate you to explore all the different types of Data in the Wild out there on the internet. Use #DataInTheWild to show us where you go to find data for your vizzes. Also be sure to check out the new Sample Datasets tab on the resources page of our new website if you need more motivation!
"Go forth and prosper and make lots of cool vizzes with Data in the Wild"
Autres sujets pertinents

Meet Iron Viz 2024 Finalist Jessica Moon
 15 avril, 2024

Meet Iron Viz 2024 Finalist Pata Gogová
8 avril, 2024

Student to BI Analyst, How Tableau Can Lead to a Successful Data Career
 20 mars, 2024
Abonnez-vous à notre blog
Recevez toute l'actualité de Tableau.