How to make sales data actionable with TC sessions


With the amount of time, effort, and information that goes into closing deals, there are many opportunities to be more effective and make quota. From having more relevant details about your accounts to speeding up or eliminating time spent on administrative tasks, having actionable data is at the heart of improving sales performance. This message was heard throughout Tableau Conference with the dozens of sales-focused sessions. With hundreds of sessions on-demand, you have enough content to last you through to next year, but with leads to follow up on and accounts to manage, you need to use your time wisely. We've highlighted a few sessions with tips and best practices you can begin using today to optimize sales tools, speed up and simplify territory creation, and make sales data relevant to your entire organization. Here are summaries of these sales-focused sessions from Comcast, LinkedIn, and from us at Tableau. Discover key takeaways with links to the recording for you to watch and share with your teammates.
Measuring and optimizing sales enablement tools
Five to seven years ago, Comcast offered cable, internet, and home phone services, but today, the depth and breadth of offerings is mind-blowing. For those working in sales, the Comcast team has built a robust analytical program to optimize for sales excellence worth noticing.
In their TC19 session, "Comcast: Measuring and Visualizing Sales Excellence," the National Sales Strategy & Insights team at Comcast reviewed their how they set out to build tools to measure the impact of sales, combining multiple data sources from Salesforce, Excel, Tableau, among others.

Focused on usage and engagement of sales enablement tools for coaching, lead management, and reporting, Senior Director Yasmin Ndassa and Jim Multari, Vice President of National Sales Strategy & Insights, wanted to have a complete view of sales performance to share with sales managers and senior leaders. To identify leaders and laggards, Jim and Yasmin designed dashboards in Tableau Desktop to reveal underperforming sellers. The reporting was shared with sales training and communications teams to accurately interpret the sales data and make insights actionable for sellers. Partnering with these channel owners resulted in increased awareness and deployment of best practices, motivating tool usage and adoption for improved sales performance.
Diving into Tableau Prep flows, Yasmin called Tableau Prep a "lifesaver," because the intuitive flows didn't require her or her team members to know SQL fluently. (Those interested in Tableau Prep learned to use it in just a few days.) This autonomy reduced their dependence on the data operations team and resulted in time savings, allowing the Comcast team to quickly spin up reporting they needed. Jim and Yasmin described how this analytics framework has helped their team, and the sales organization, be more independent, agile, and productive—while also accelerating their speed to insight.

Sales territory planning
An important part of having a balanced, happy, and successful sales team is creating equitable sales territories. This is easier said than done. Luckily, there are methods to creating custom territories—quickly—by using the Tableau geospatial functionality. This also gets around the need for a separate, territory-creation specific tool that only serves that one purpose. Two members of our sales operations team, Hunter Barcello, Sales Operations Data Scientist, and Justin Kruger, Manager of Sales Operations, detailed how they were able to reduce the amount of time spent on territory creation by 55 to 65 percent for each territory. They shared their approach to building territories, going through a demo on for valuing postal codes in their "Optimal Sales Territory Planning" session at Tableau Conference.

Justin and Hunter offered best practices to an effective territory rollout, discussing which sales KPIs can guide how you select and weight territories. With a focus on efficiency, accuracy, and partnership across the sales organization, Hunter and Justin detailed what you need in order to roll out territories successfully:
- Specified timeline
- Engaged stakeholders
- Clearly defined and documented segmentation, or "rules of engagement"
- Headcount and growth plan
- Clear definition of customer and key metrics
These best practices—and how they are documented and communicated—are especially crucial as your sales organization grows and needs to scale, quickly onboarding new team members so that they understand the why behind certain decisions. Well-documented segmentation and communication is also necessary to working well with leaders in both sales and other parts of the business to establish relevant KPIs that will frame how you balance territories. Hunter described his method for having brainstorm sessions with stakeholders to land on sales metrics, like the following based on postal code, to produce a model to test if these KPIs are the right ones for achieving their goals:
- Number of customers
- Transactions
- Customer spend
- New customers
- Product adoption or saturation
Next, Justin and Hunter discussed the benefits of clustering geographies: they reduce numerous postal codes into manageable groups, are flexible, are algorithmically fast. They followed up with a demo on how to plan territories for three account managers, with the goal of aggregating down the smallest unit in their data set—in this case, down to the post-code level, mapping out ownership of each postal code. (This matters because doing this reduces the amount of time salespeople spend on "non-ROI" activities, like disputing who owns an account or lead.) The demo used Tableau Prep workflows to scale the data, preserving relationships and allowing easy comparison across measures, Tableau Desktop, and R.

Connecting sales data to business outcomes
In his session, "LinkedIn: How Tableau Helped Us Drive Business Outcomes at Scale," LinkedIn Senior Insights Analyst Pavels Kilivniks described his data journey and how his career path evolved after learning Tableau: from building his first sales dashboard as an account strategist to becoming an analyst who develops reporting that impacts business-wide change.
Pavel described his daily difficulty in managing the millions of data points while working in LinkedIn Marketing Solution's Ad Business. The need for a sophisticated dashboard became a pressing one, so engineering, product, and data science teams rolled up their sleeves and got to work. While many trackers were created over the years, it was still hard to find the information Pavel and his team needed to answer critical questions, providing a more accurate view of the Ad Business to leadership.
Deeper analysis to compare data over time—across quarters or years—wasn't possible without the help of a special team that had an enormous backlog of requests and long turnaround times for reporting. Pavel and his team were spending 240 hours every year (5 hours per person every week) manually entering data into documents and spreadsheets.
Encountering data issues around accuracy, lack of granularity, and overly complex reports, Pavel decided to create a solution that would provide both high-level and detailed performance insights. He envisioned a tracker that had 100% accurate, up-to-date data that was simple to use, but he lacked SQL and Tableau skills to build it so he committed to teaching himself Tableau in three months, leaning on the Tableau Community to answer questions. After three months, Pavel released a simple Tableau dashboard that presented account performance month-over-month.
Sales reps found that the dashboard helped them impress clients with their deep knowledge of the account and their industry, making them more effective in closing deals. They felt the dashboard empowered them to lead strategic conversations with their managers as well. Pavel also heard from relieved sales managers who could now answer these critical questions with his tracker:
- How much is each key account contributing per month?
- Which accounts are increasing in performance week over week? Which are declining?
- What is the best estimate or forecast for this quarter?
What started with a simple table refreshed daily via Tableau Server has evolved into a robust dashboard solution that provides a holistic view on the performance of all advertising accounts. Pavel's tracker enables sales teams to unlock new revenue opportunities and optimize under-performing campaigns, helping sellers deliver in their day-to-day jobs by giving them actionable insights.

Want more resources for improving sales performance with data? Discover demos, dashboard starters, and more here.
Autres sujets pertinents

Data Literacy for All: Free data skills training for individuals and organizations
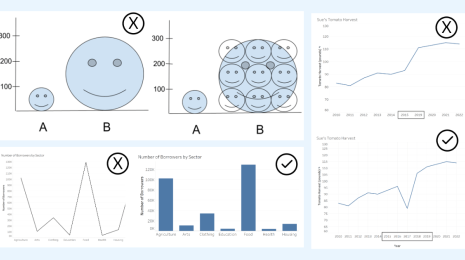
How to Spot Misleading Charts, a Checklist
 15 novembre, 2023
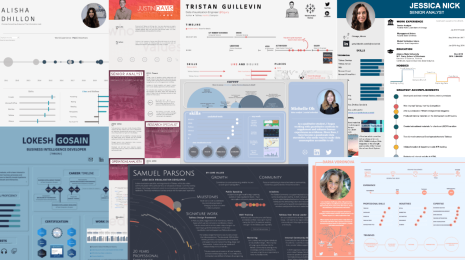
Boostez votre recherche d'emploi avec un CV Tableau interactif
 8 décembre, 2022
Les recruteurs ne consacrent que 6 secondes à la lecture d'un CV. Démontrez votre talent pour la visualisation des données et démarquez-vous en présentant votre CV de façon visuelle et interactive dans Tableau.
Abonnez-vous à notre blog
Recevez toute l'actualité de Tableau.