Dive into details with improved table visualizations
To make tables even more powerful and flexible, we’ve added support for up to 50 columns with horizontal scrolling, and a more intuitive sorting experience.


A table (or crosstab) is a simple and powerful viz type—it puts the data right in front of you. We see customers using tables in all sorts of scenarios, from sales or SKU performance summaries, to financial analysis and compliance use cases. To make tables even more powerful and flexible, we’ve added support for up to 50 columns with horizontal scrolling, and a more intuitive sorting experience. Let’s take a look at how you can take advantage of these new capabilities in the context of your authoring workflow.
Author wider tables with up to fifty columns
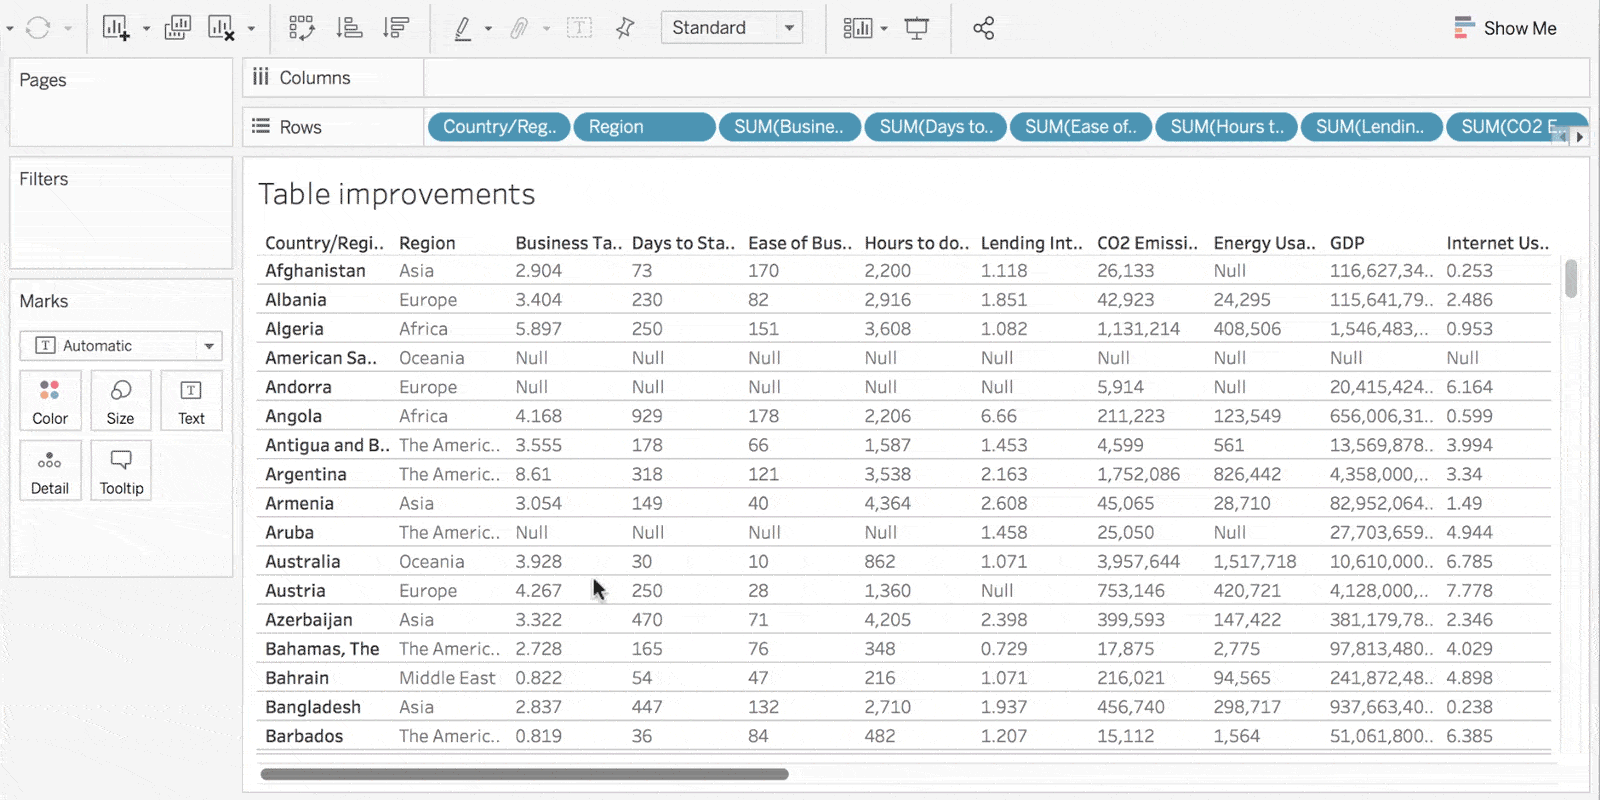
To get started building your table, simply drag and drop discrete fields (blue pills) on the Rows shelf in your worksheet. Adding each discrete field will add its respective column to the table—up to a maximum of 50 columns. In order to build a list table like the one below, you will need a unique field (per row) as the leftmost column in your view, such as Row ID.
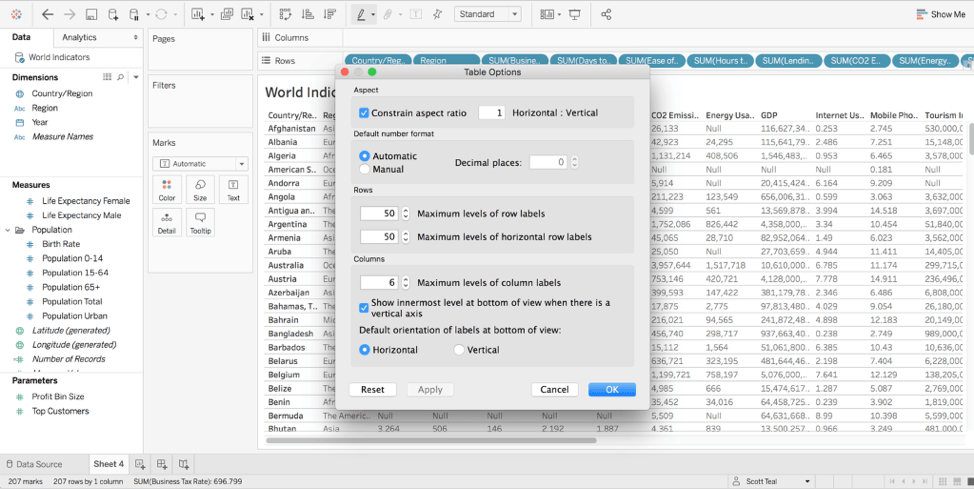
In addition to increasing the column limit, we’ve made improvements to make it easier to navigate these wide tables. With Tableau 2019.4, you can now horizontally scroll across the entire table, to see all of your dimensions and measures.
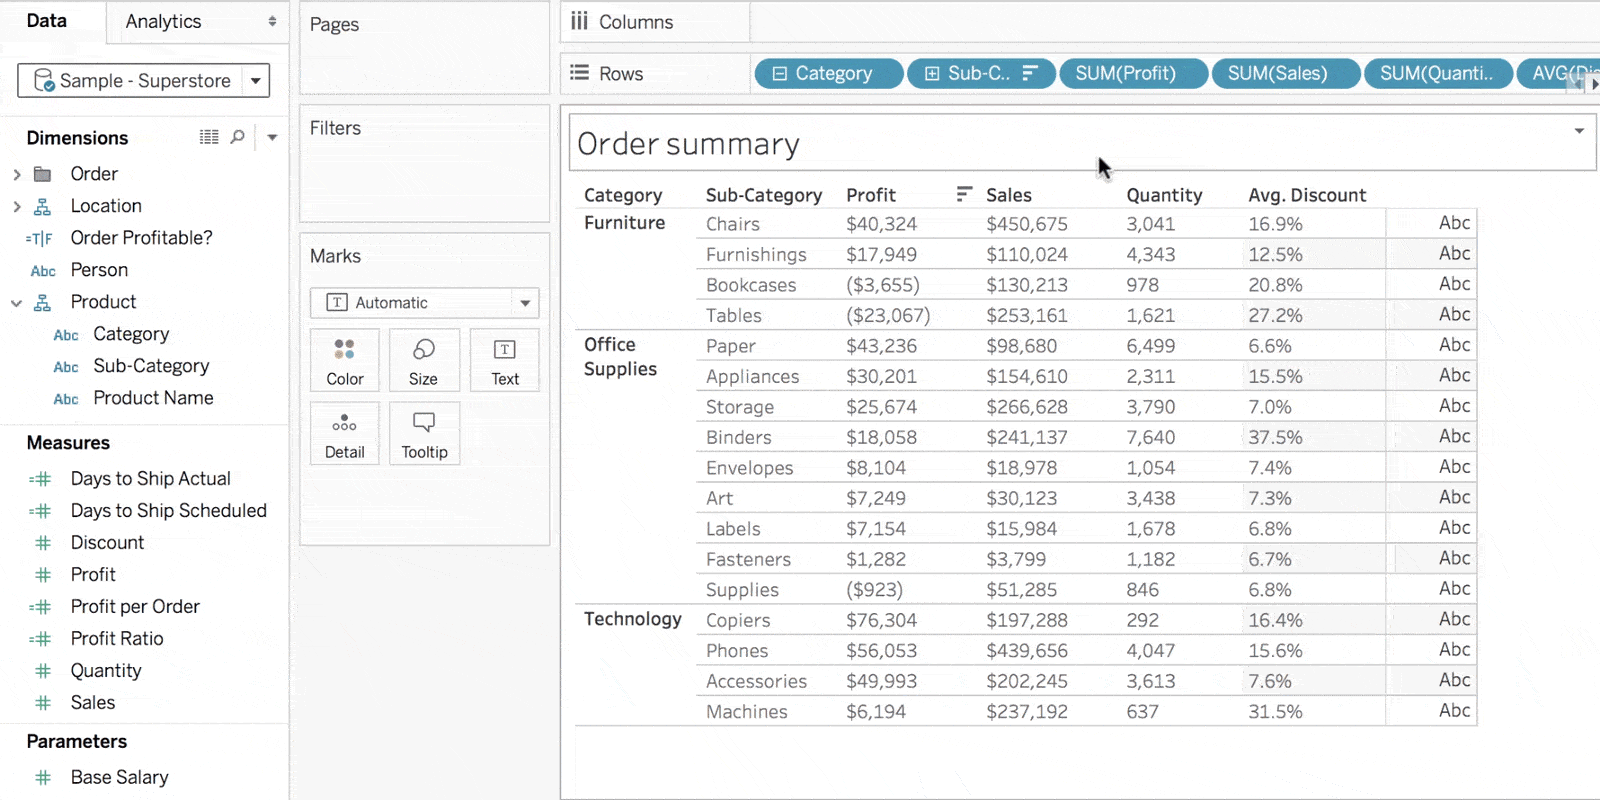
Sort by any dimension or discrete measure
We’ve also made sorting more useful and intuitive, with the ability to sort the entire table by a discrete measure or dimension. Simply click on the column header to sort the entire table. In the below example, seeing all of my orders sorted by highest to lowest sales, or quantity, takes just a couple of seconds.
Three tricks for working with tables
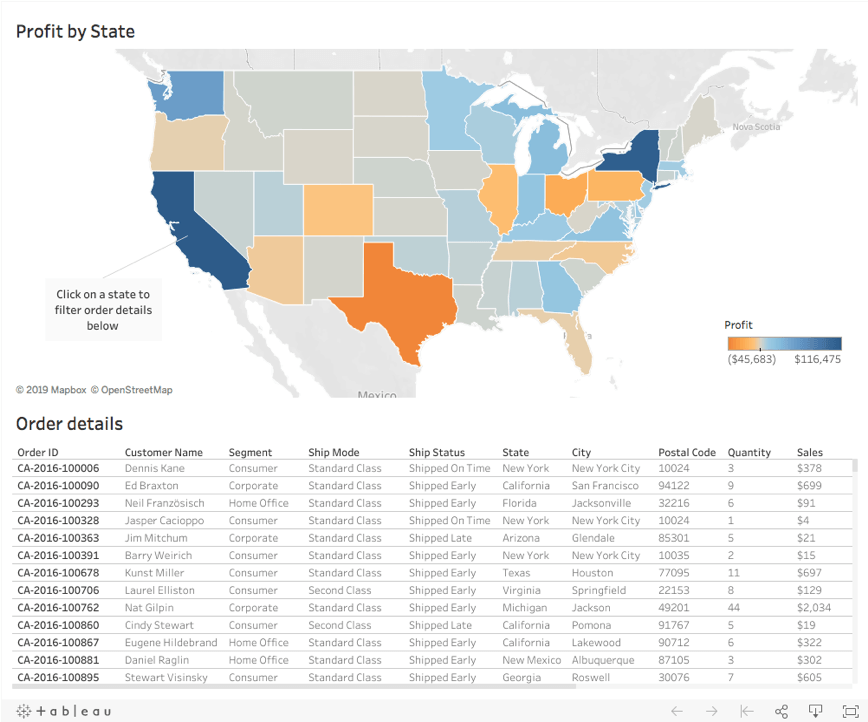
As simple as the end result looks, there are some tricks to making an impactful table. We’ve highlighted some of our favorite approaches below. Use a table as a supplemental viz — Tables are great for getting to a granular level of detail. At the same time, all of the details can be hard to understand without some surrounding context. Consider building dashboards with a primary high-level viz, such as a map or scatterplot, and supplement it with a table below. This makes it easy for the user to drill down into a mark, and view further details as needed.
Full-width scrolling vs. Continuous fields — Have you ever wondered why a full width scrollbar is displayed only in certain scenarios? It all depends on what fields you have in the view. Tableau interprets discrete and continuous fields differently when creating a table. For example, if you have a table with all discrete fields on the Rows shelf, then a full width scrollbar will be displayed. In the case of a table with both discrete and continuous fields, and depending on your screen size, only the continuous fields will scroll with the current scrolling behavior. Be sure you’re sorting on unique fields per row Have you clicked on a column header and the column didn’t sort as you expected it to? As we mentioned earlier, make sure your viz has a unique field (per row) in the leftmost column—such as Row ID or Order ID—which will be different for each row in your table. A field like Customer Name may not work, because the same customer could have multiple orders, showing up as the same name in multiple rows (a non-unique field per row). In that case, you can create a combined field with unique values to add as the leftmost pill in the table, and if you’d like, hide that field from the viz.
Get started today, and learn more!
You can get started with these new table improvements when you upgrade to Tableau 2019.4. And there’s so much more—learn about what else is new in our latest release.
Autres sujets pertinents
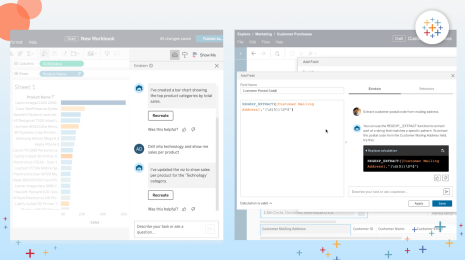
Who is Einstein Copilot for Tableau for?
 10 avril, 2024

Securely Access and Analyze All of Your Data with Data Connect for Tableau Cloud
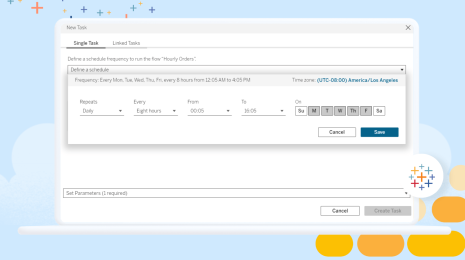
Tableau Prep Conductor Supports Custom Schedules
 15 mars, 2024
Abonnez-vous à notre blog
Recevez toute l'actualité de Tableau.