Best of the Tableau Web: Welcome to the new bloggers!
In the latest Best of the Tableau Web, the community shares a variety of tips and tricks to make your data come alive.


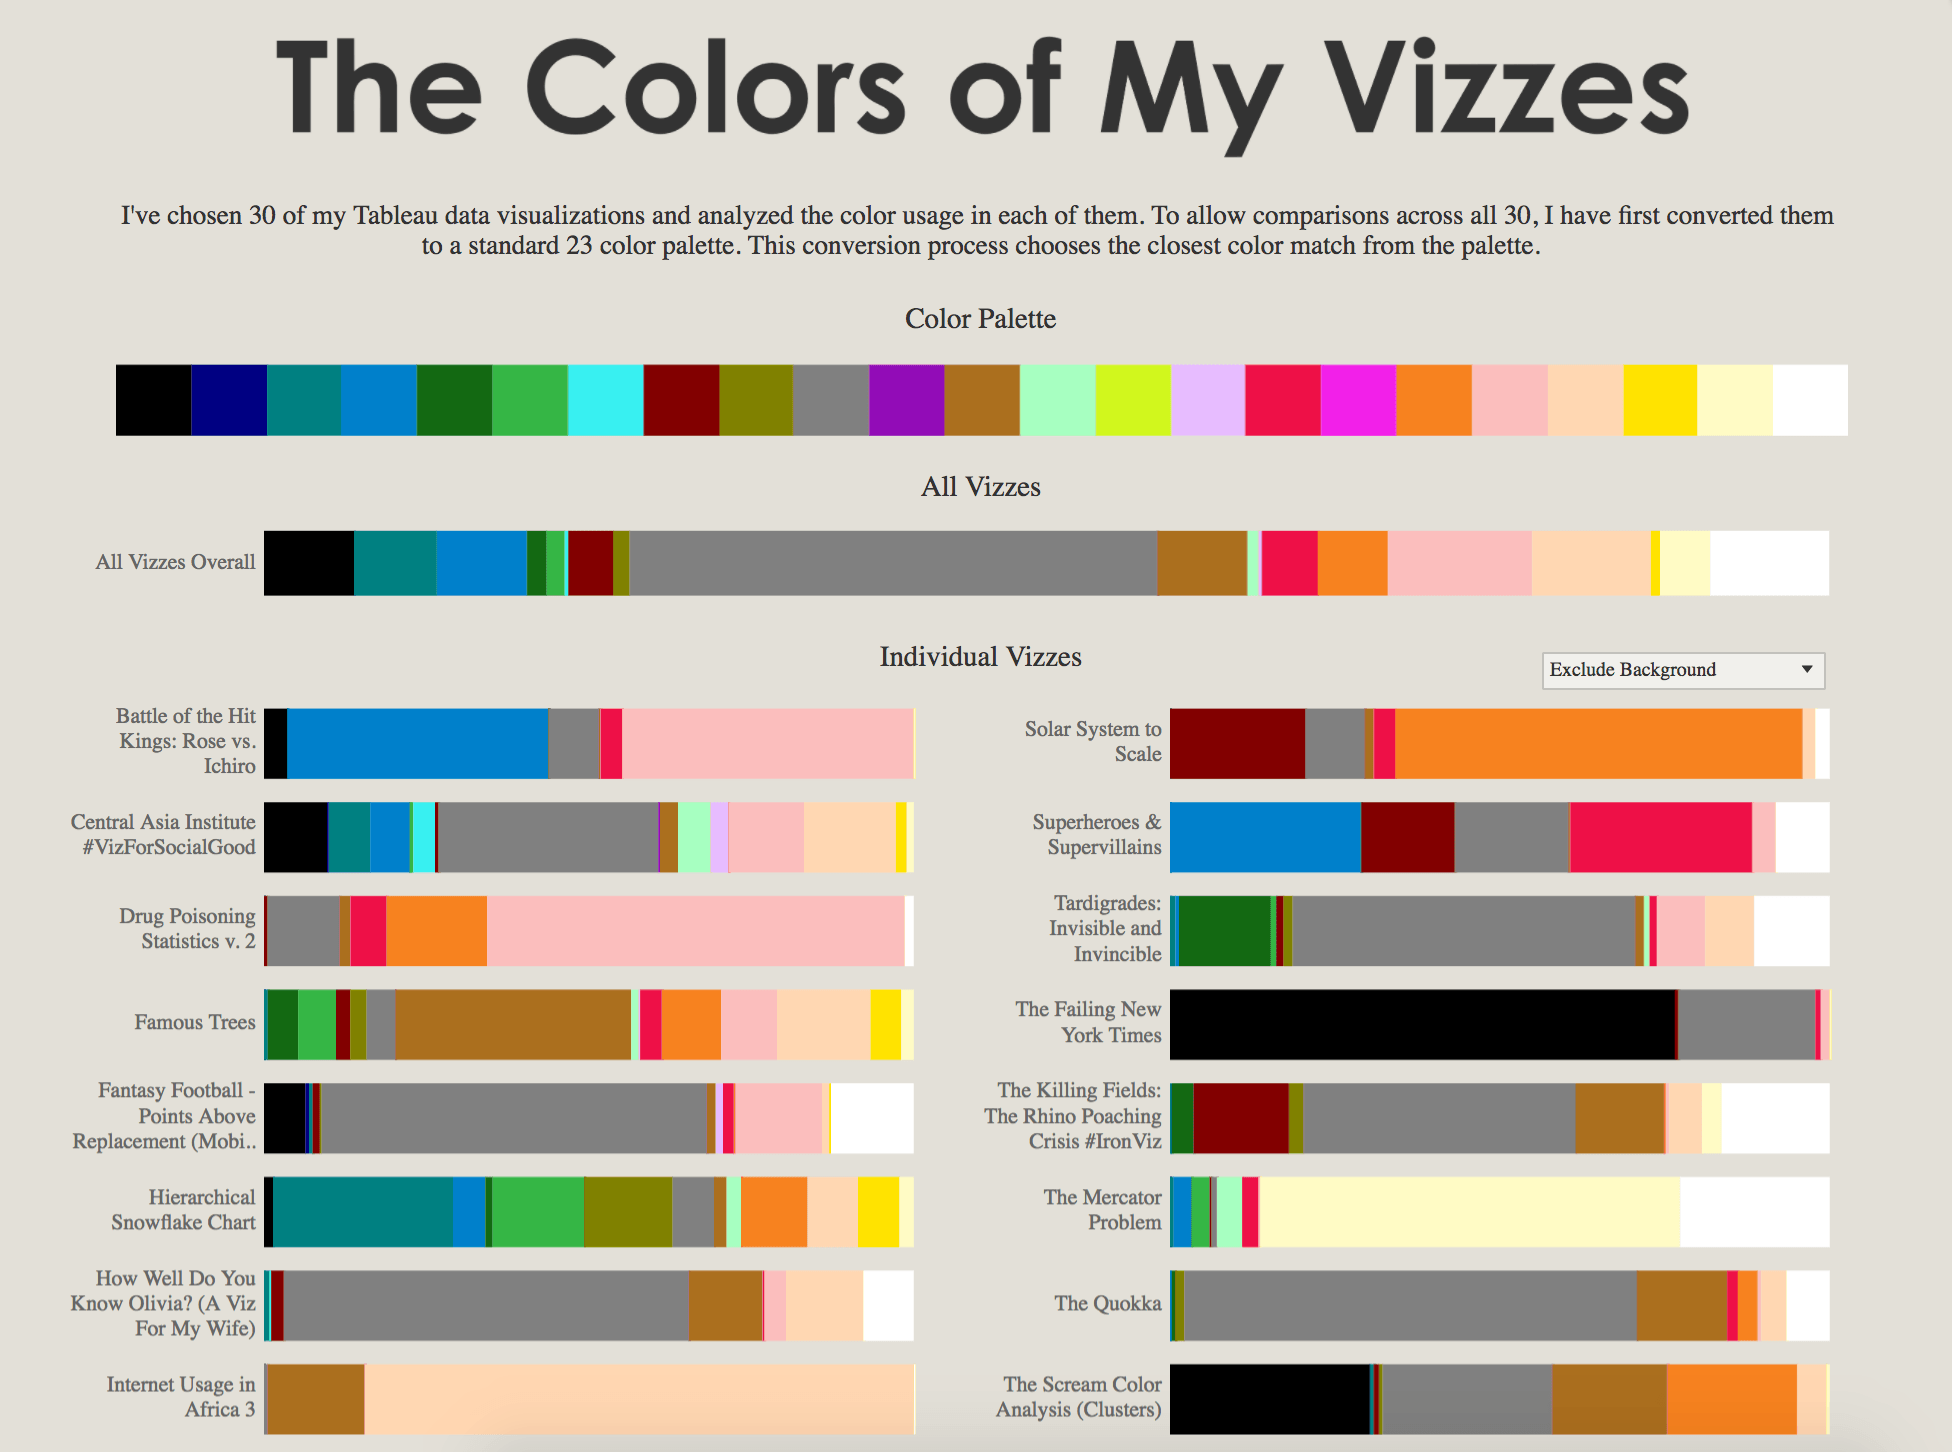
I really enjoyed Ken’s meta-analysis of his vizzes colors this month.
It’s time for another round up of the best of the Tableau blogosphere. Thank you to our great community contributors for another great month. This month includes a bounty of new authors, some of whom weren’t known to the community a year ago. Why does this make me happy? Primarily because it shows that there is always space for fresh ideas and new people in our community! We hope you enjoy these posts. And if they inspire you to start a blog, then send your details our way and join our vibrant, and growing, community!
Tips and tricks
Data Revelations Survey Data — Don’t Ignore the Neutrals
Data + Tableau + Me How to area bump chart in Tableau
Vizible Difference End-of-Line Trend Indicator without Dual Axis
Elena Caric Help, my data is not structured right? Data preparation with Tableau—the Data Source Page
Mina Ozgen Improving Tableau Performance Series 1: Filters
Mike Cisneros On Tilt: Rotated Scatterplot Charts
LearningTableauBlog #TakeapartTuesday—Dual axis Gantt chart
Getting vizzy with it The Power of Tableau’s PDF Connector
Elena Hristozova Tableau Containers: My Approach in 9 Tips
Things Tableau Tableau Whale Curve/ Pareto Charts
Ryan Sleeper 3 Ways to Use ALT Code Characters to Enhance Your Tableau Dashboards
Code
Data Boss Tableau Filestore Consistency Checker—How Repository Maps to Filestore
William Guicheney Sentiment Analysis Using Tableau and R
Tableau Tim Mobile device test Tableau dashboards without a device
Inspiration
Ken Flerlage Vizzes About My Vizzes
Viz Simply How to get good at Tableau
Jackson Two The Importance of Certification
TableauFit The Shape of Stores: Analyzing Film Cutting Speed for Tableau’s Iron Viz
Les Vis Tableau 2017—Conference Tips!
Server
AJ Basnet How to keep your data up-to-date in Tableau Server?
Autres sujets pertinents

Meet Iron Viz 2024 Finalist Jessica Moon
 15 avril, 2024

DataFam Roundup: April 8–12, 2024
 12 avril, 2024

Meet Iron Viz 2024 Finalist Pata Gogová
8 avril, 2024
Abonnez-vous à notre blog
Recevez toute l'actualité de Tableau.