Using Python for sentiment analysis in Tableau
If you haven't used Python before, have no fear—this is definitely achievable for novices. Read on!


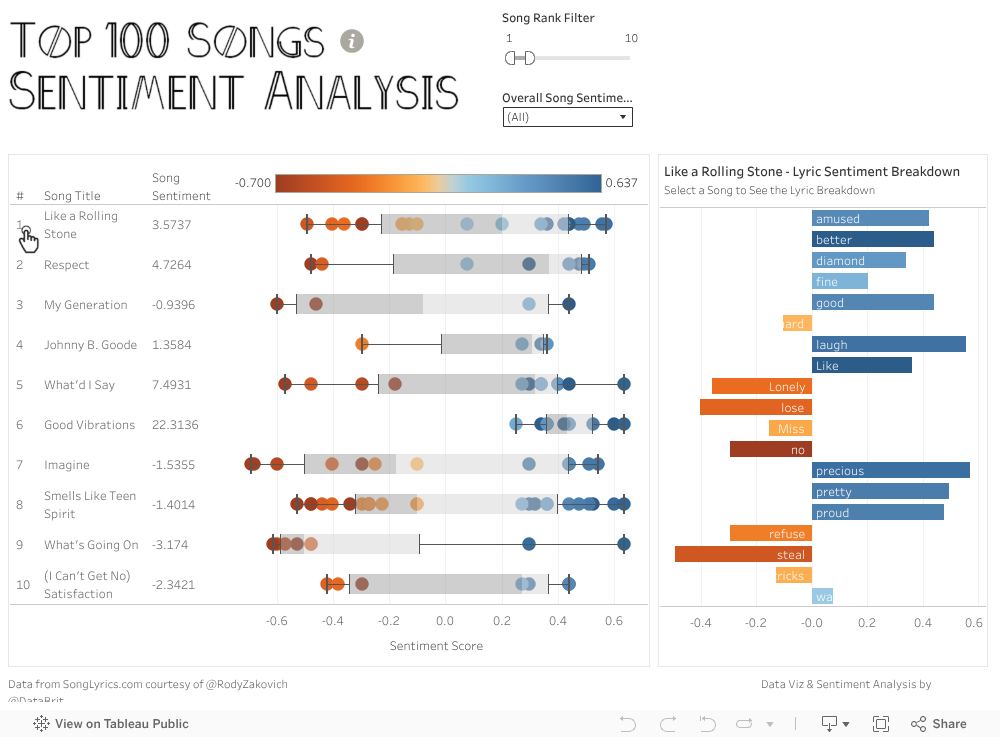
A recent Makeover Monday data set was on the top 100 songs' lyrics. I'd been eager to try Tableau's new TabPy feature, and this seemed like the perfect opportunity. I'll share a step-by-step guide on how I did this. If you haven't used Python before, have no fear—this is definitely achievable for novices. Read on! Some context before I begin: I have limited experience with Python. I recently completed a challenging but great course through edX that I'd highly recommend if you are looking for foundational knowledge. The syllabus included advanced Python including classes and thinking about algorithmic complexity. To run the analysis I did, it would be helpful to look up and understand at a high level:
- basic for loops
- lists
- dictionaries
- importing libraries
The libraries I used for this, should you want to look up additional documentation, are:
- pandas
- nltk
- time (this one isn't really necessary; I just used it to test computation time differences between TabPy and local processing)
I have a Mac. If you're trying to reproduce with a PC, you can find install instructions here.
1. Setting up your environment
Read through the install directions. Here's my simplified version for those not comfortable with GitHub or command line:
- Click the green "clone or download" button
- Select "download"
- Unzip the file and save locally (I moved mine to my desktop)
- Open your terminal and navigate to your TabPy folder. It should contain a file named setup.sh. Run this command:
bash startup.sh
If you see this after your install finished, you're all set:
INFO:__main__:{"INFO": "Loading state from state file"}
INFO:__main__:{"INFO": "Initializing tabpy"}
INFO:__main__:{"INFO": "Done initializing tabpy"}
INFO:__main__:{"INFO": "Web service listening on port 9004"}
Now if you're like me and you're not successful on your first try, it may be because you have an older version of Python than the required 3.6+. Or you might have both versions, but your primary is the older version. You can manually create a Python 3.7 environment (courtesy of Bora Beran). In your terminal, run: conda create --name Tableau-Python-Server python=3.7 anaconda Then activate it and do the pip install from local folders:
pip install -r ./tabpy-server/requirements.txt
pip install ./tabpy-client
pip install ./tabpy-server
2. Connecting to TabPy in Tableau
Now it's time to setup your TabPy in Tableau. In Tableau 10.1, go to Help > Settings and Performance > Manage External Connection. Enter "localhost" since you're running TabPy on your own computer. The default port is 9004, so unless you manually changed it, you should leave it at that. 
3. Creating your TabPy calculation
The TabPy Github page has extensive documentation you should review on using Python in Tableau calculations. I simply repurposed one of the calcs they demoed during the TabPy session at #data16. Catch the replay here. Using the top 100 songs data set, create the following calculated field: https://gist.github.com/GirlMeetsData/c7c0cb116c924b17eef689d27032f8f0…
Everything following # is a comment just to help make sense of what the code is doing. Feel free to remove that text. Now you can use this calculated field in views with [Word] to process the sentiment score! The downside is that since this is a table calculation and also uses ATTR, you cannot use this within a Level of Detail calculation. So unfortunately, you cannot calculate the sum of the sentiment on the level of detail of song using this example and data structure. (With some data manipulation it is possible, but I won't be diving into that.)
TabPy vs. pre-processing data for Tableau
Unfortunately, you cannot publish vizzes using TabPy to Tableau Public. If you want to download the .twbx version I made using TabPy, you can do so here. However, you could run this analysis outside of Tableau and simply import the output and create your viz that way. I did this which also gave me more flexibility with LODs since I was no longer using TabPy. TabPy definitely took me less time and required less code. Below is what the code would like like outside of TabPy. You can run this code in a Jupyter notebook or another IDE. I used Spyder only because I used that for my class. You can download my Tableau Public viz which uses the output of the below code to inspect further!
For more tips, ideas, and vizzes by Brit, check out her Tableau Public profile page and her blog. You can also connect with her on Twitter @DataBrit.
Makeover Monday fans, join us on Monday, Dec. 19 for a #MakeoverMonday Twitter chat! Hosts Andy Cotgreave and Andy Kriebel will kick things off at 4 p.m. UTC.
Autres sujets pertinents

Visualizing Women's Impact to History Through Data Visualization
 18 mars, 2024

Behind the Viz: Adrian Zinovei Helps You Design Your Next Dashboard
1 mars, 2024

Charting the Heart: Data Visualizations on Love
 14 février, 2024
Abonnez-vous à notre blog
Recevez toute l'actualité de Tableau.