#Data16 keynote: Tableau’s three-year roadmap


Some 13,000 data rockstars gathered to hear the #TableauVision keynote at TC16.
We, like you, are data people. Our mission is to help people see and understand their data, because we know data can empower people to achieve great things. In short, we work toward our mission so you can achieve yours. It’s what drives all of us at Tableau.
To do your best work, you need an analytics platform that allows you to make the most of all your data in your organization. This platform should answer deeper questions and scale as your usage increases all while keeping your data secure. Join our pre-release program to test-drive these features when they become available and let us know how they solve your problems.
And that’s where we come in. As we shared during the keynote at TC16, every part of our product roadmap is designed to empower you and your entire organization to make better decisions faster with data. Here is a small sample of what we have planned for the next three years.
A new data engine for faster analysis
As your volume of data grows exponentially, your user expectations are also growing. You need immediate responses to your questions. You need the freshest data. And you need it at enterprise scale.
To solve this, you need a new kind of data engine for the modern analytics era. That's why we’re building a new in-memory data engine with Hyper, the fast database technology we acquired earlier this year.
Hyper enables fast analysis on billions of records and near real-time data updates. It's designed to simultaneously process transactional and analytical queries without compromising performance. This means you’ll be able to scale to perform sophisticated analysis on large data with incredible performance.
Hyper will also enhance Tableau’s hybrid data model. You’ll still be able to connect live to over 50 different sources that Tableau supports. This means you can leverage the capabilities of databases like Amazon Redshift, Google BigQuery, Snowflake, and Microsoft SQL Server, or choose to bring some or all of your data into Tableau with Hyper.
In the next few months, we’ll be deploying Hyper with the massive scale of Tableau Public and Tableau Online. The beta for Hyper will start in early 2017.
Project Maestro: A self-service data-preparation tool
We know that getting data ready for analysis is a time-consuming and difficult process. And what we’ve heard from you is that there is an extended set of data-prep activities that our data stewards perform to support others in their organization. That’s why we’re excited to announce a brand new data-prep product codenamed Project Maestro.
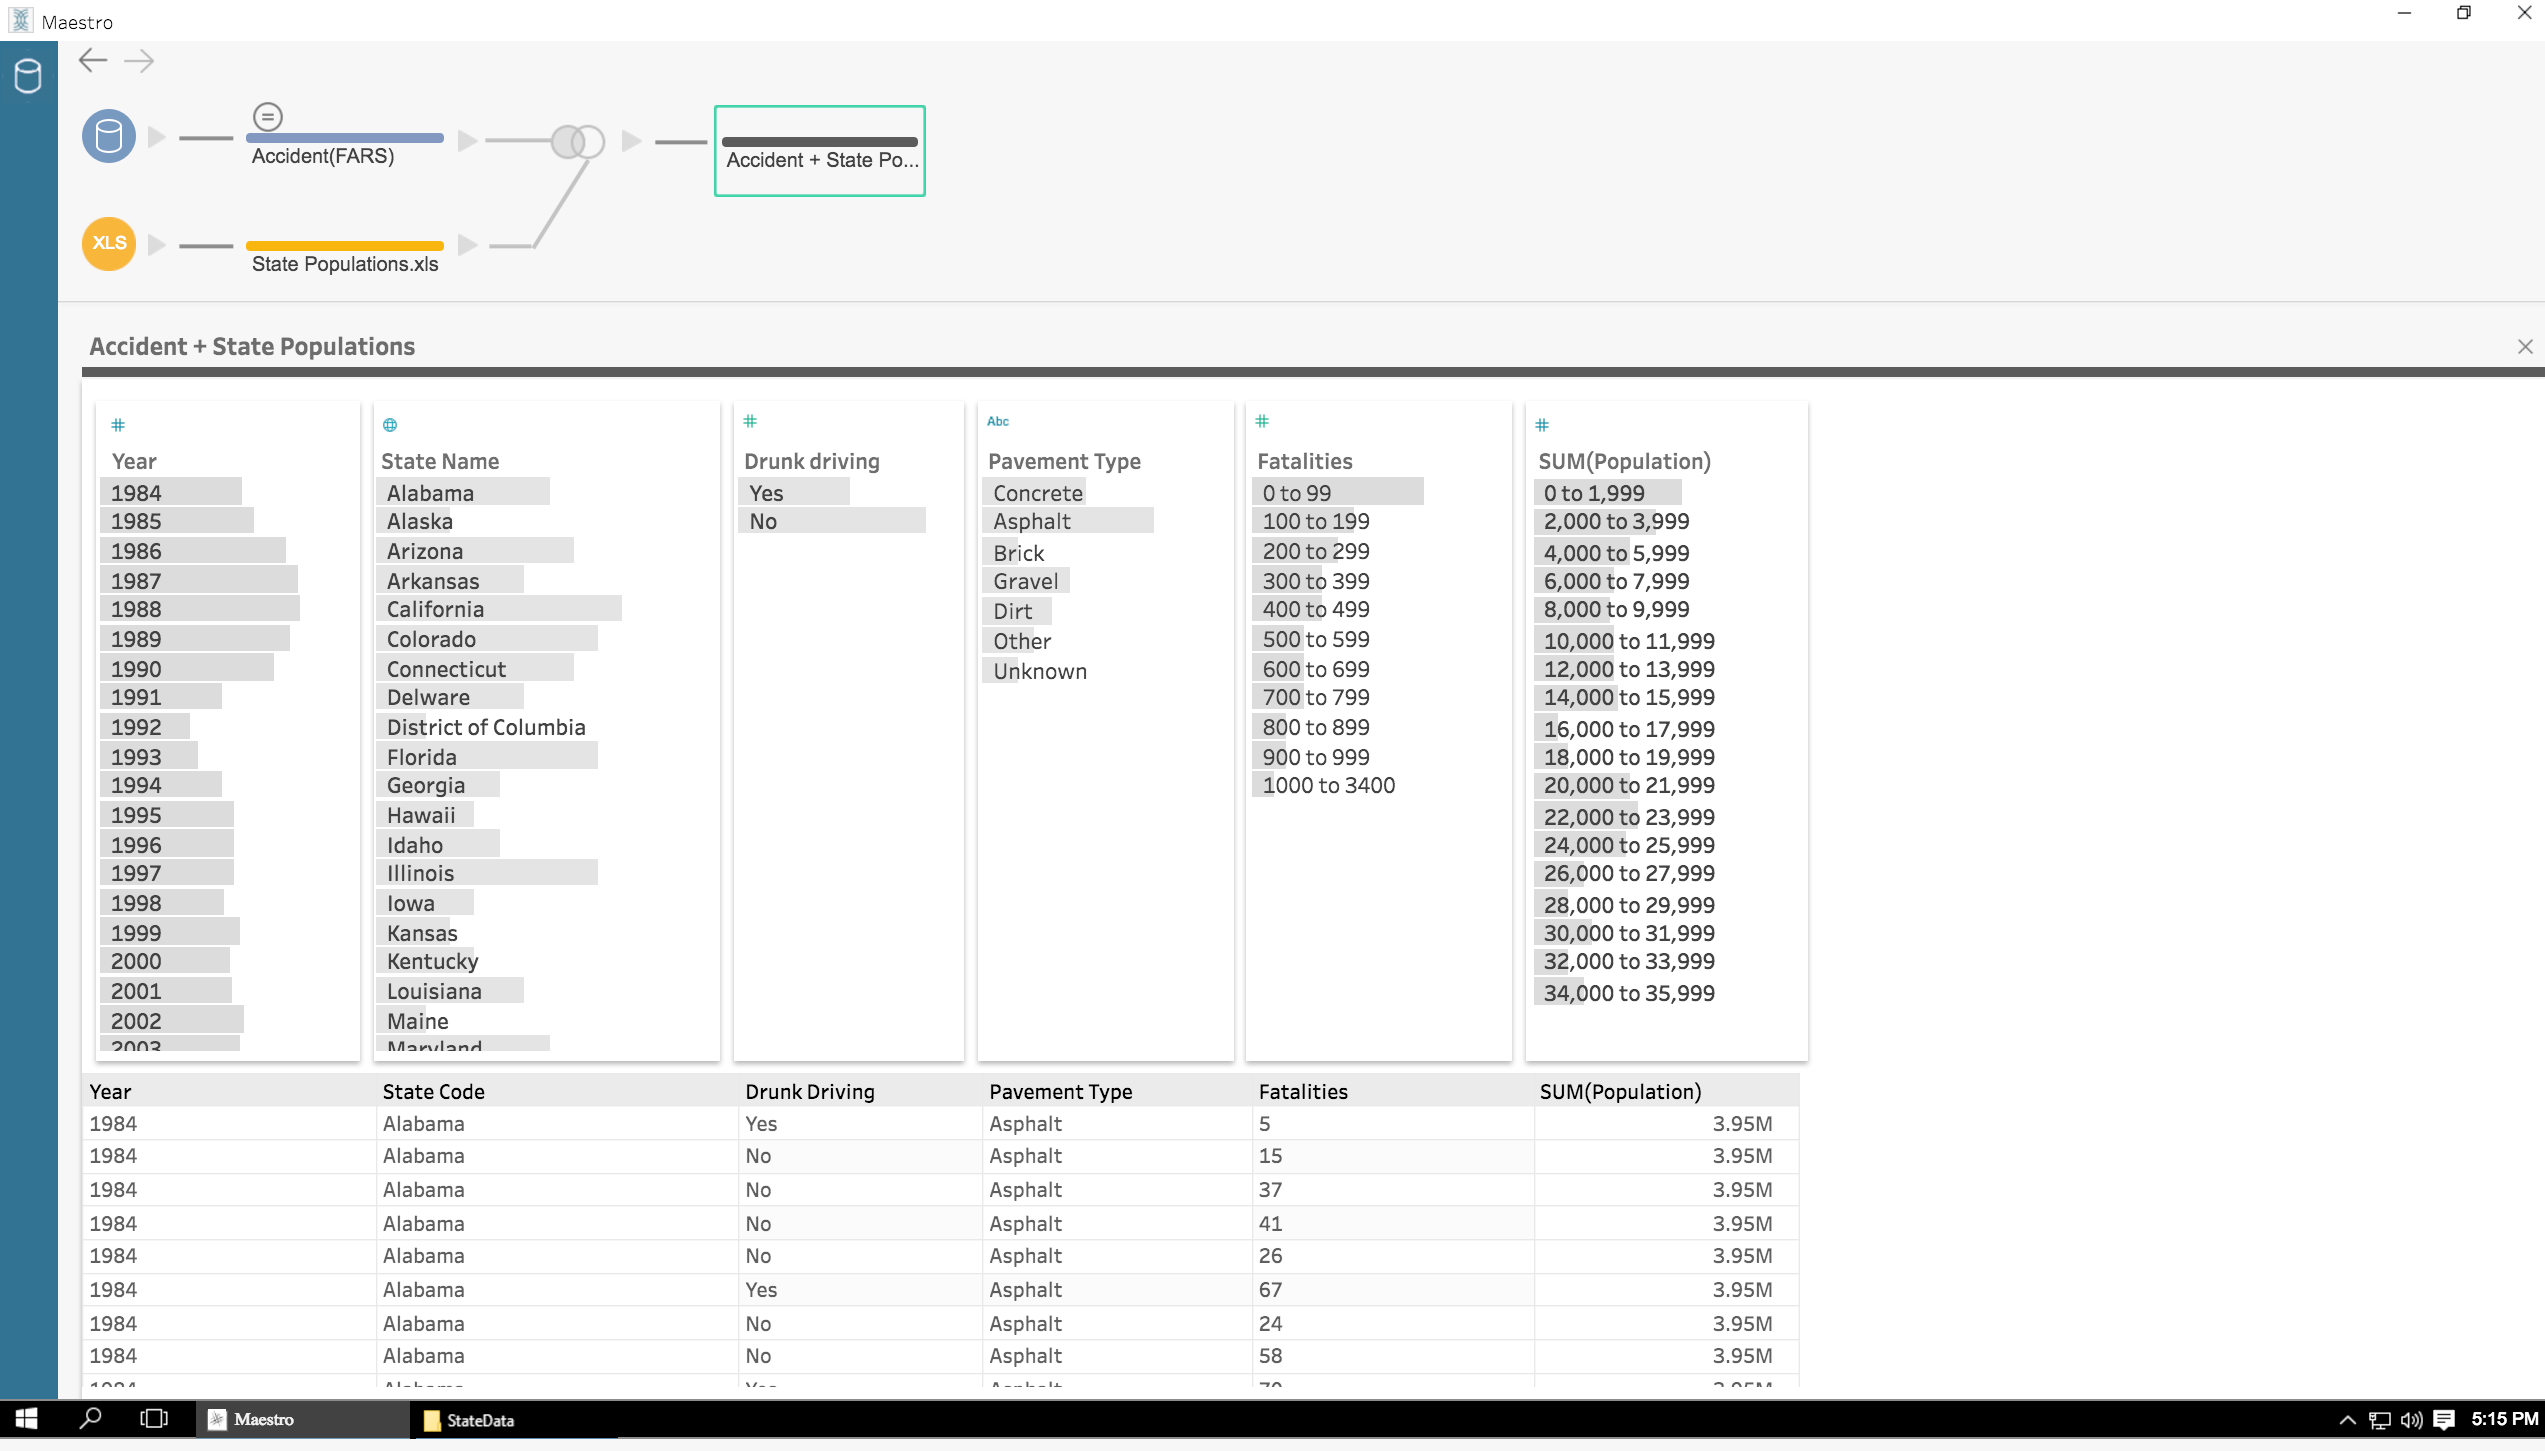
Project Maestro will make it possible for more people, from IT to business users, to easily prep their data with a direct and visual approach. You’ll instantly see the impact of the joins, unions, and calculations you’ve made, ensuring that you have exactly what you need before jumping into analysis.
Project Maestro will also integrate with the rest of the Tableau platform, letting you quickly publish your data to Tableau Online or Tableau Server, or analyze it in Tableau Desktop.
To learn more about Maestro, sign up for product updates.
Governance built in
As analytics is deployed in organizations, we need to carefully balance governance with freedom. Specifically, we need to enable IT to maintain control while empowering people to ask and answer questions of their data.
Having a self-service environment where everyone can surface data is a great thing—as long as you can determine when to use what, and which data sources are trustworthy for the task at hand.
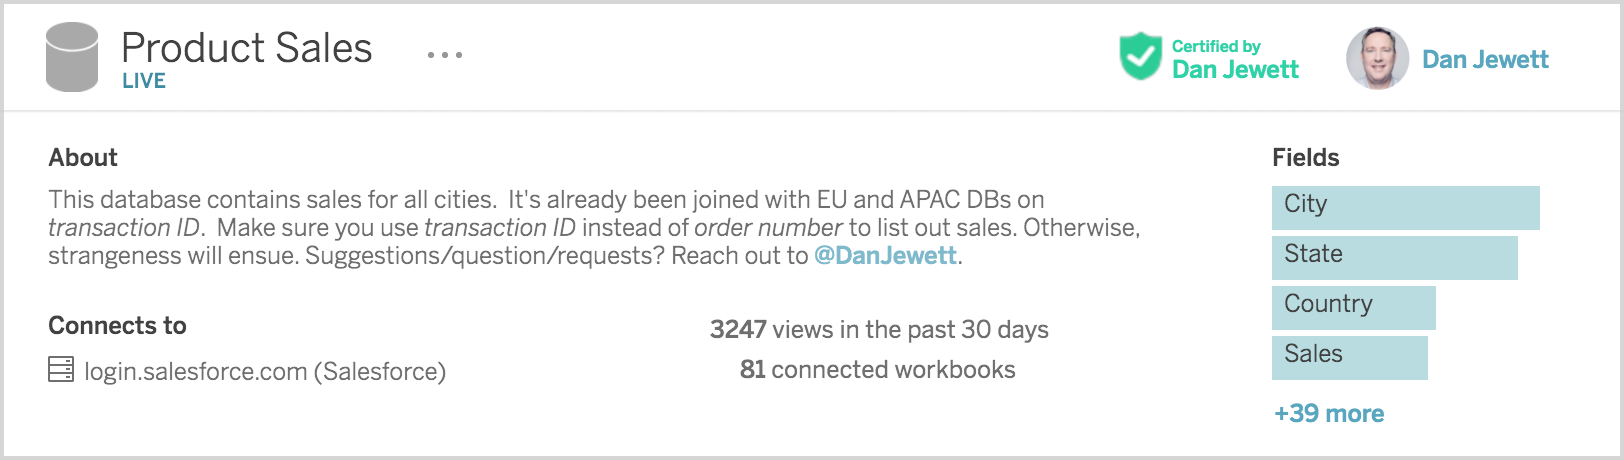
This is why we’ll be introducing certified content within Tableau Server to help both IT and the business users. It allows IT to define the proper joins, security rules, and performance optimizations as well as create the standard calculations the rest of the organization relies on. And business users can select a certified data source and be sure the data is accurate and trustworthy.
We are also enhancing the Tableau Data Server to support agile data modeling so you can understand how your centralized data models are used by the community. You’ll be able to perform visual impact analysis to help you understand the impact of changes you might make to the data source.
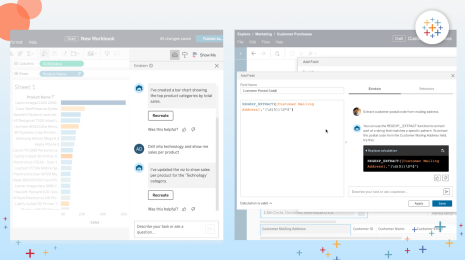
Instant and natural: The next leap in analytics
We’ve always been focused on making analysis visual, interactive, beautiful, and approachable. Visual analysis has been a pillar of our R&D efforts. It lets us ask better questions, think more deeply, and solve bigger problems because it puts the power of data into the hands of more people.
Our vision is simple. We want to answer more questions visually and increasingly answer some questions automatically.
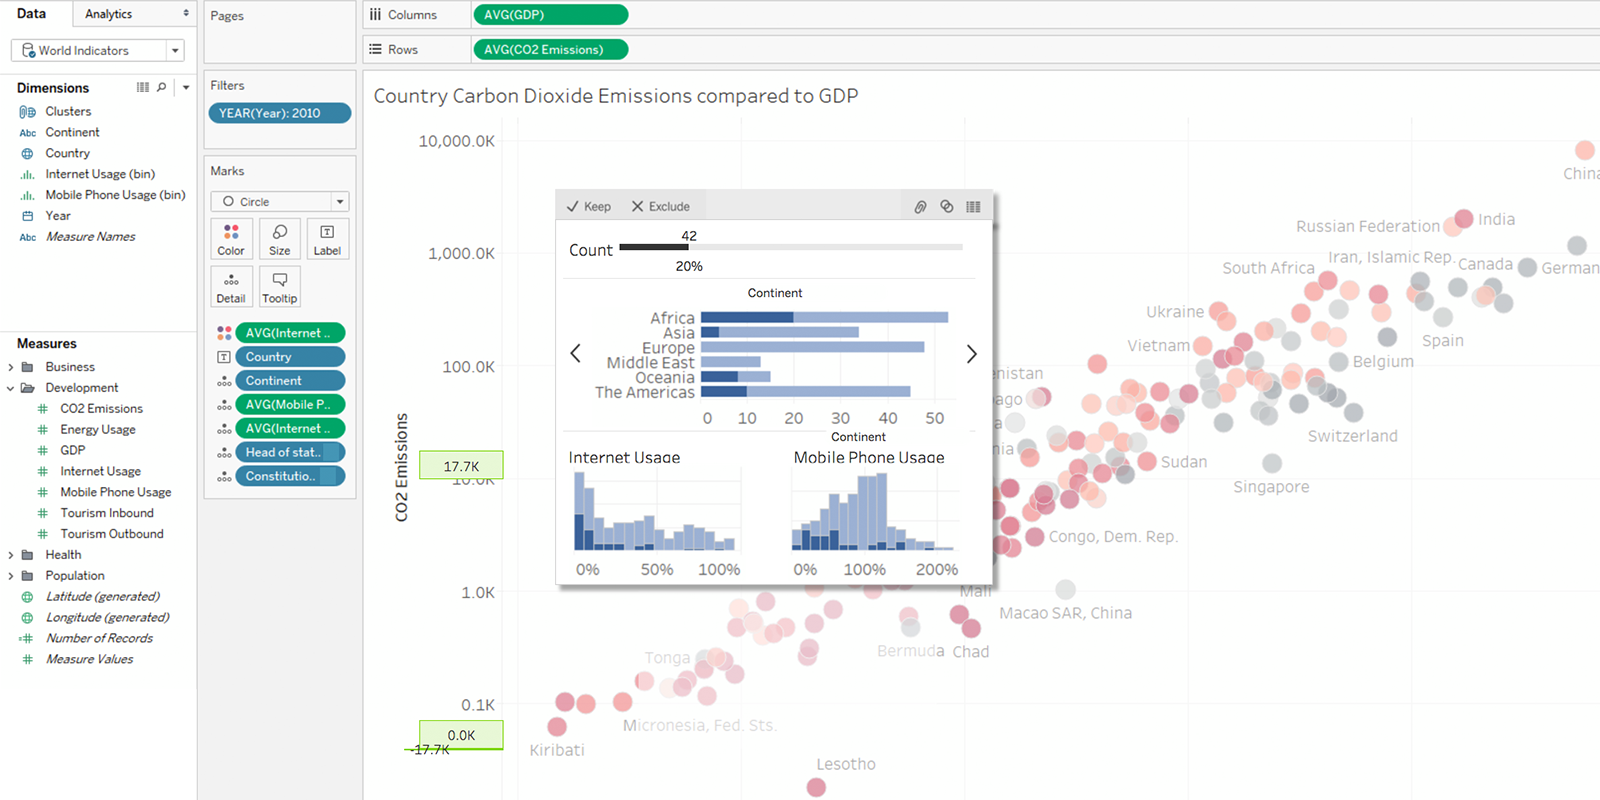
What if Tableau could look at what you were doing and be one step ahead of you, answering new questions for you or suggesting next steps? That’s our vision for a feature we’re calling instant analytics.
Imagine being able to see the distribution of measures right in the tooltip, no setup required. As you interact with your data, instant analytics automatically provides contextual information to help you find insights faster.
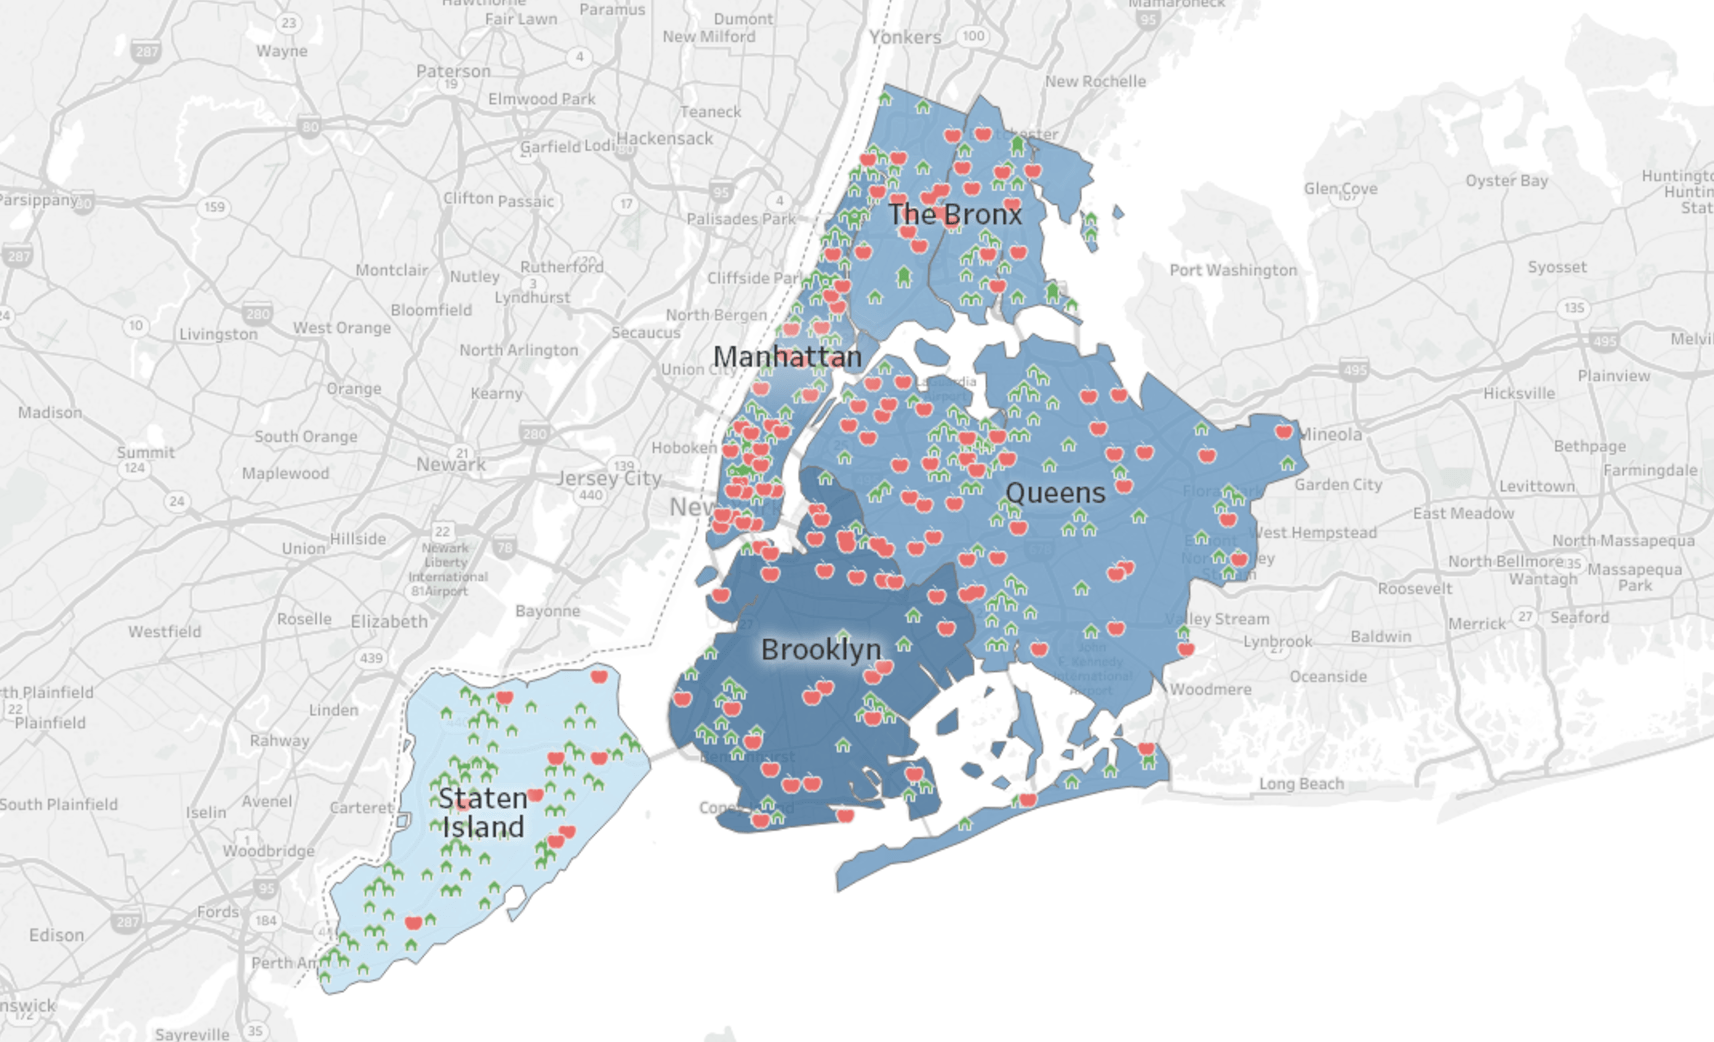
And since location-based data is so common, we want to make it a natural part of analysis. That’s why we’re working on map layering, which will allow you to layer different sets of data on a single map.
We’re also working to help you analyze time-based data. You’ll soon be able to align time-series data with a click and interact with it in new ways.
Natural language processing is already bringing new ways to interact with data through human language. And we’re not limiting natural language processing to simple statements. Tableau will be able to handle ambiguity, colloquial expressions, and conversations with your data.
New hybrid data connectivity for the cloud
Deploying Tableau needs to be simple and flexible. This flexibility includes allowing you to deploy and connect to your data wherever it lives—in the cloud, on premises, or both.
You can visualize data behind the firewall in Tableau Online using the new live-query agent that acts as a secure tunnel to on-premises data.
We’re also adding prebuilt dashboards for popular web applications like Salesforce and Marketo. Imagine leveraging our Salesforce connector to connect directly to your Salesforce data, then using our prebuilt dashboard to start exploring in seconds.
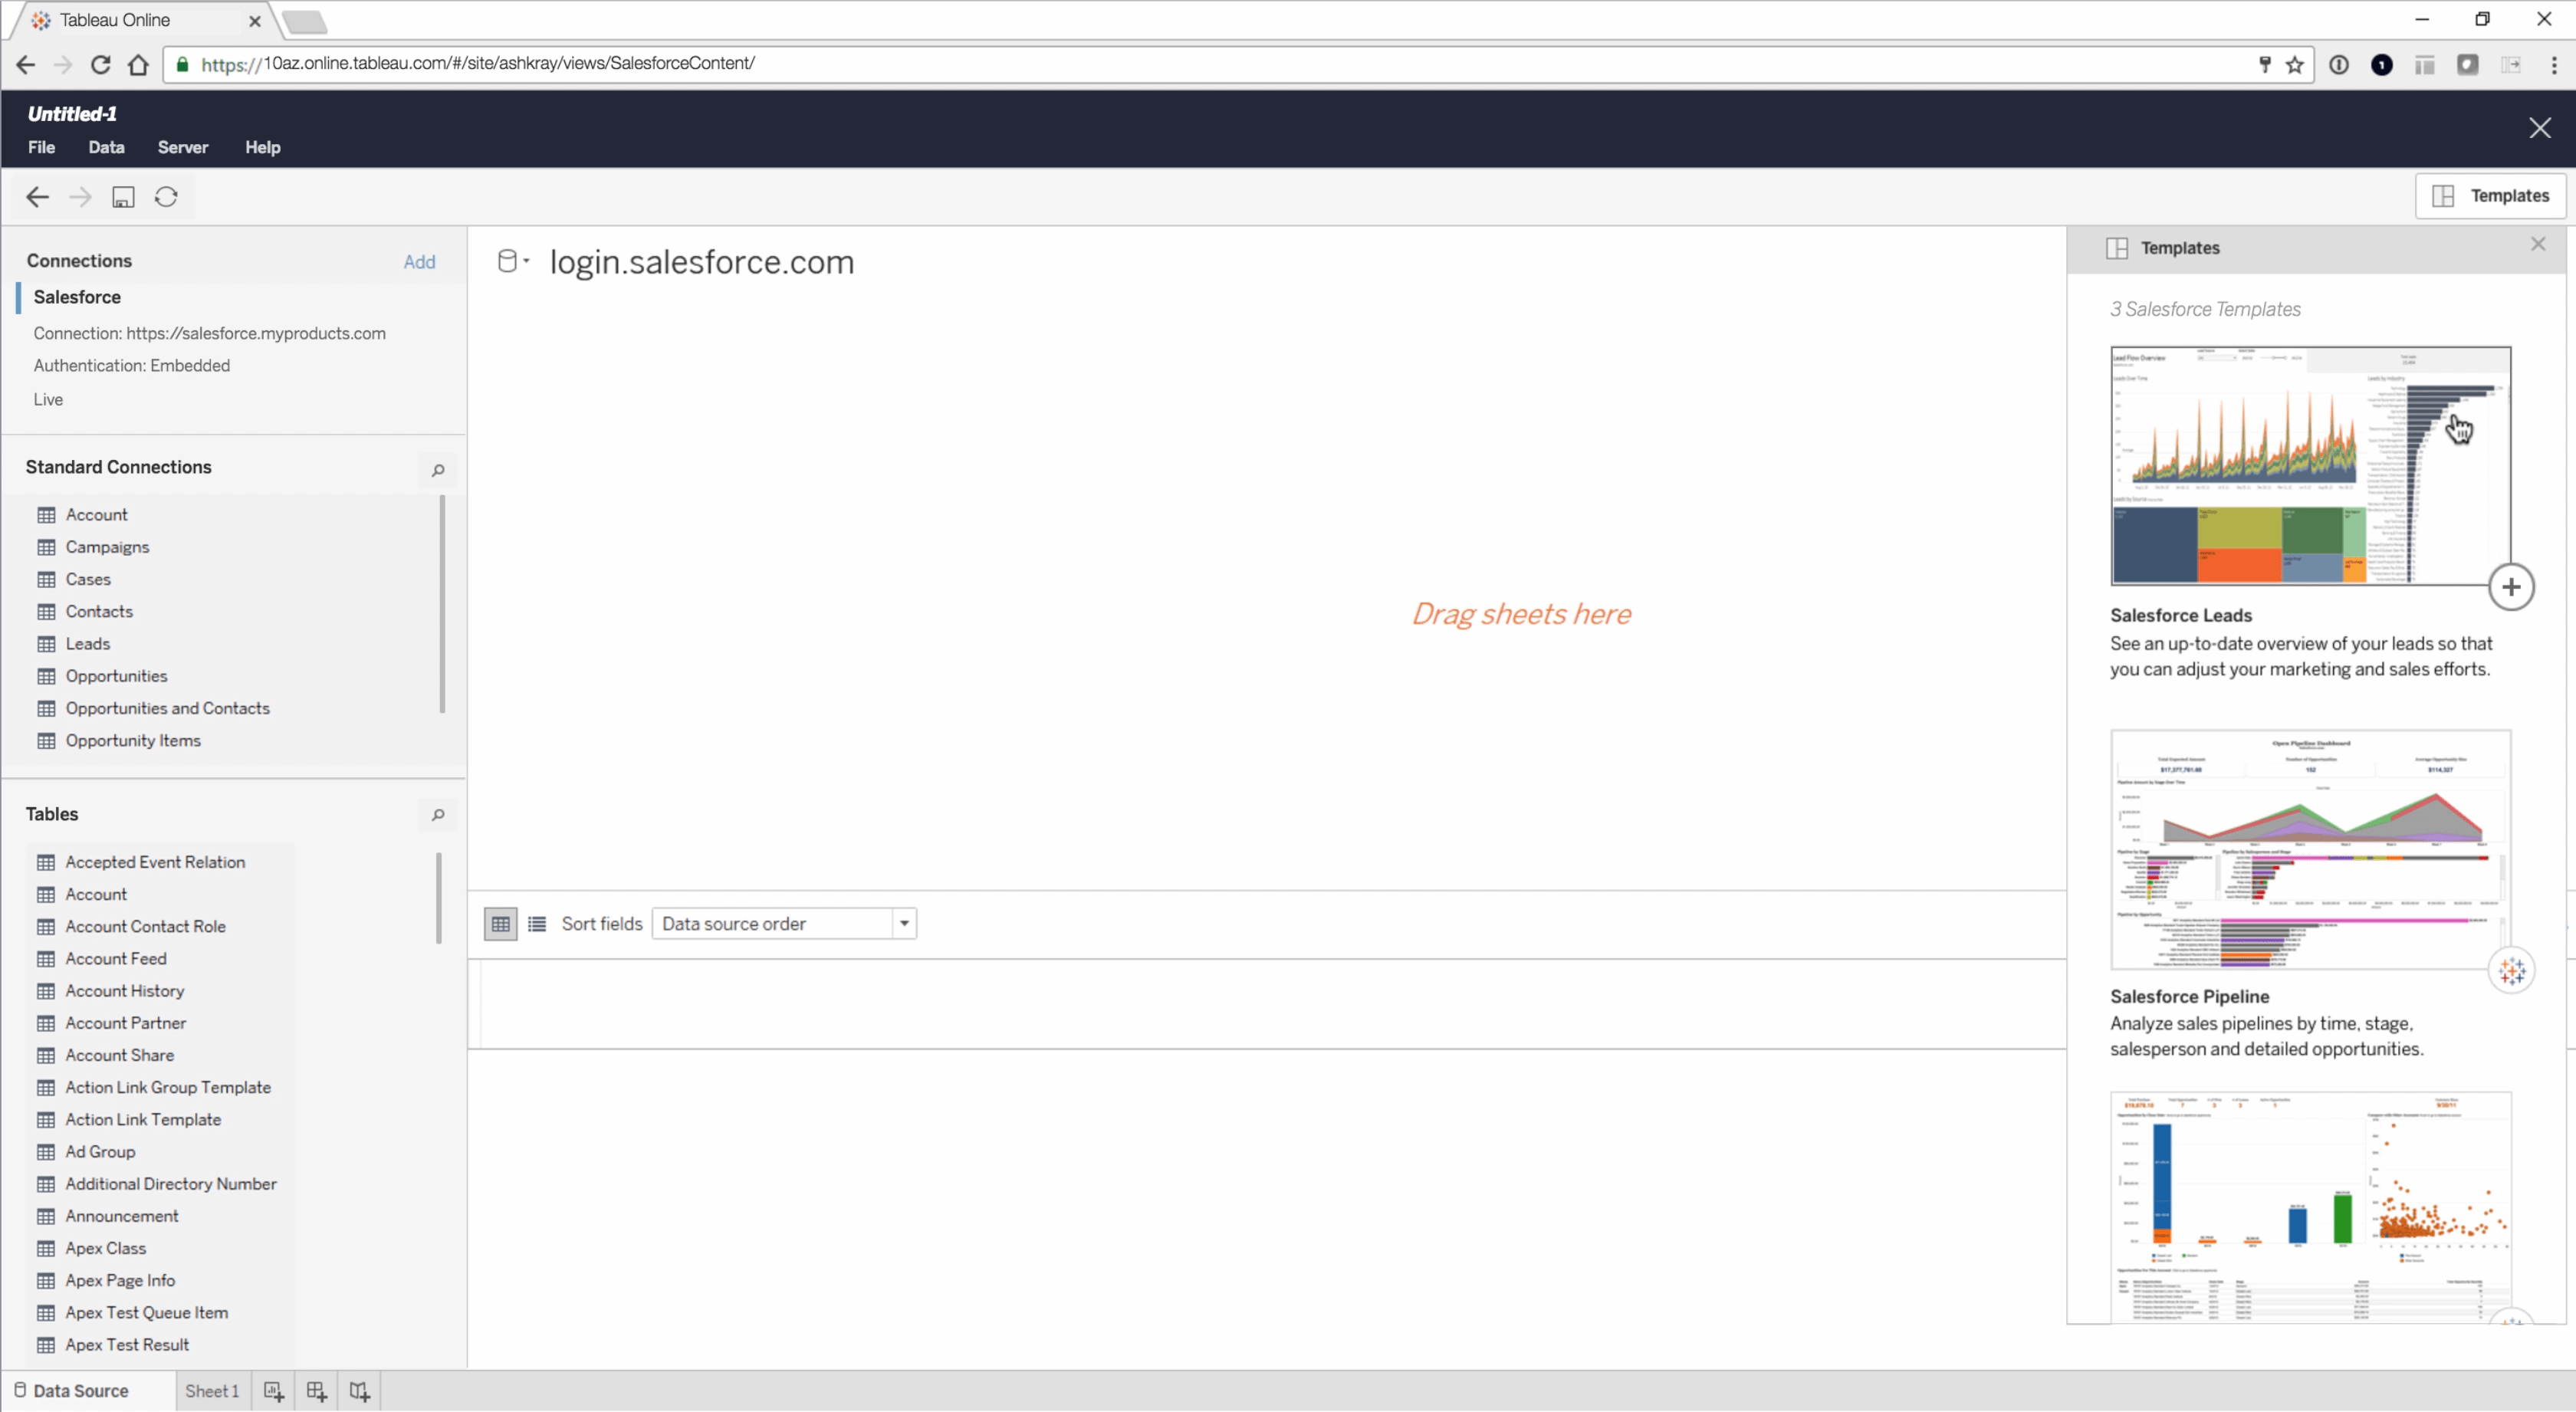
Tableau Server for Linux
We’re also proud to announce that Tableau Server for Linux is coming next year. For many organizations, Linux means lower cost, more customization, and a more secure way to run your Tableau Server in the cloud.
Tableau Server will be supported on all the major distributions of Linux. For the Linux gurus out there, we have even integrated with package management tools like yum and apt. We'll have packages for all the distros that we support in our repository.
Moving to Linux will be simple. All you’ll need to do is take a backup of your current Tableau Server running on Windows and restore that backup to Linux—that’s it.
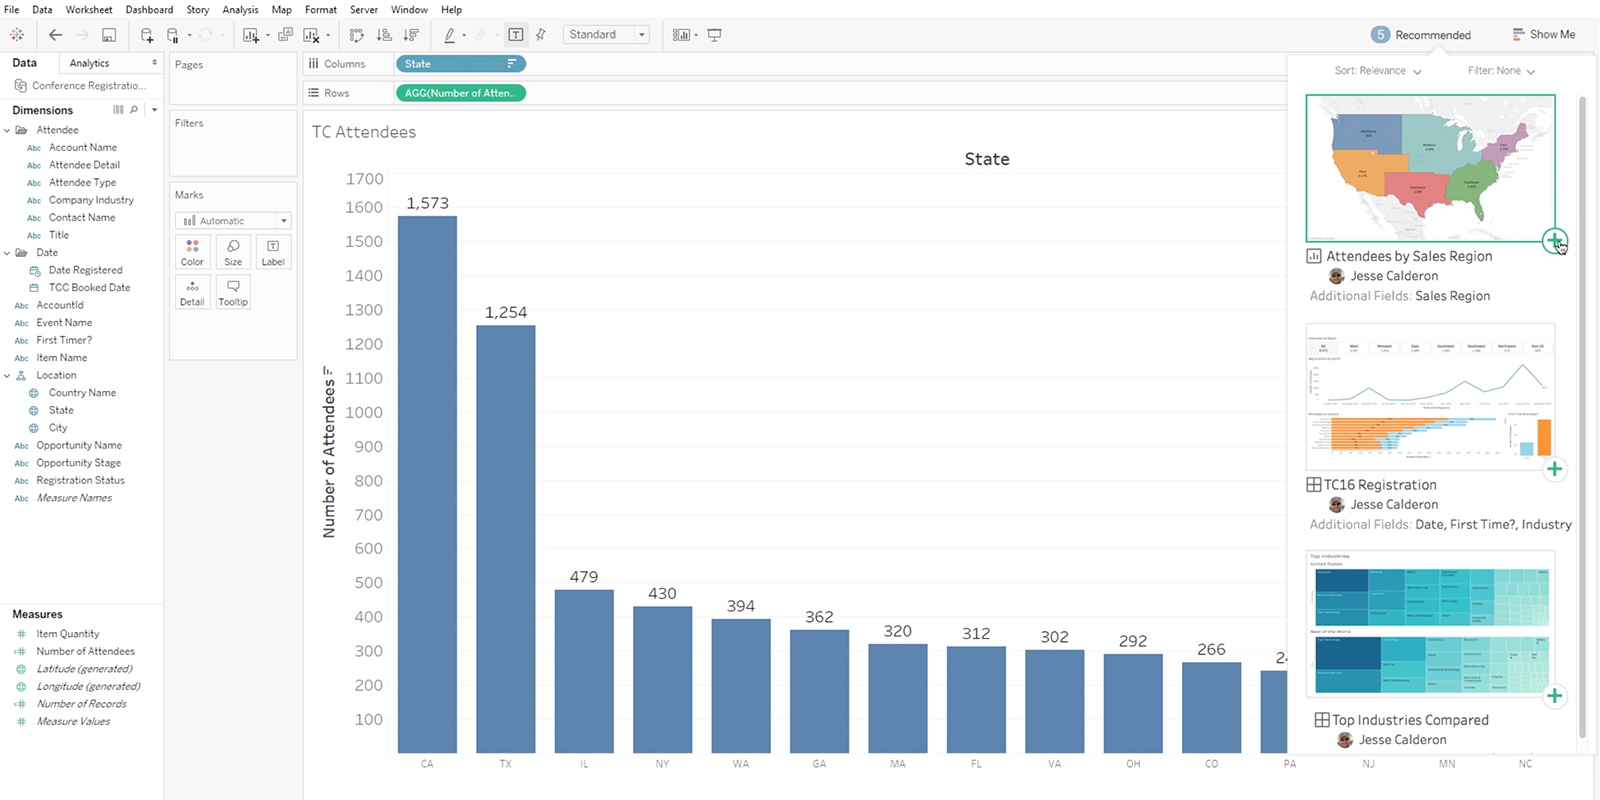
Smart recommendations
Analytics deployed at scale transforms organizations. But enabling analytics at this scale requires a unique set of features that make trusted content discovery easy and actionable.
To help people in organizations be more productive, we’re adding machine learning algorithms directly within Tableau Server to create recommendations for existing views, workbooks, and data sources. This will help your users save time and discover new perspectives in your data.
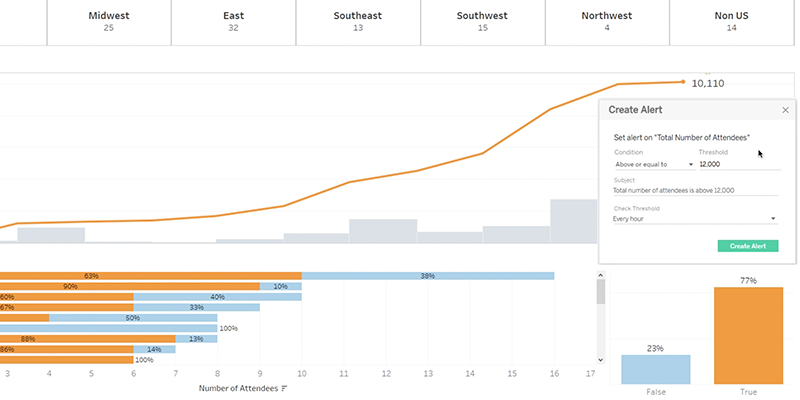
Data-driven alerting & metrics
We know you want to stay on top of your data throughout your day. That’s why we’re adding data-driven alerting to Tableau. Soon you’ll be able to quickly set an alert and be notified when metrics exceed a specific threshold. With alerts, you can keep a finger on the pulse of your business around the clock.
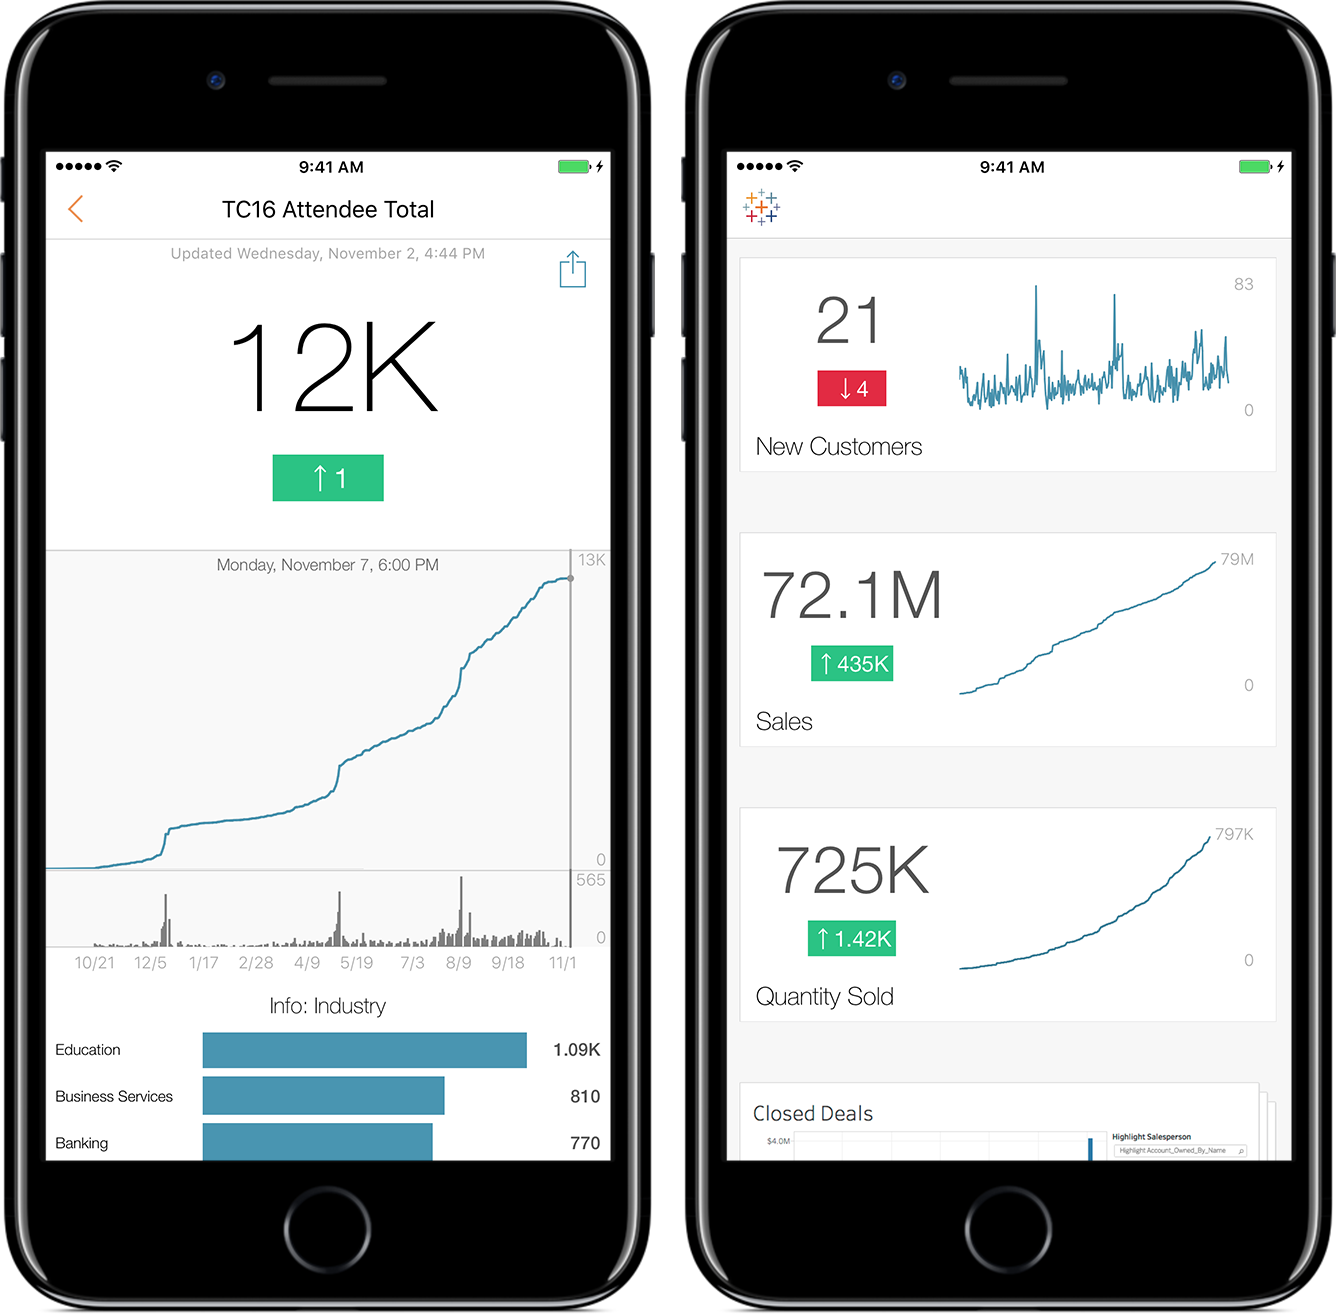
We’re also exploring a new way to give you snapshots of key data points with a feature we’re calling Metrics. These are like headlines for your data. These bite-sized views can be created from any viz, making it easy to see important numbers from multiple dashboards all in one spot.
These innovations are just a sample of what we’re working on, and we can’t wait to get them into your hands. To get there, we want your feedback. Join our pre-release program to to test-drive these features when they become available and let us know how they solve your problems.
You can also contribute new ideas and join the conversation on our Ideas Forum. Many of the highlights we shared started as ideas from you. So please keep your feedback coming and tell us how we can best help you maximize the impact of your data.
Note: Many of the capabilities and products discussed in this blog post are not currently available and may not be ready on time or at all. We advise customers to make their purchase decisions based upon features currently available and upgrade to the latest version of Tableau to enjoy the latest capabilities.
Autres sujets pertinents
Who is Einstein Copilot for Tableau for?
 10 avril, 2024

Securely Access and Analyze All of Your Data with Data Connect for Tableau Cloud
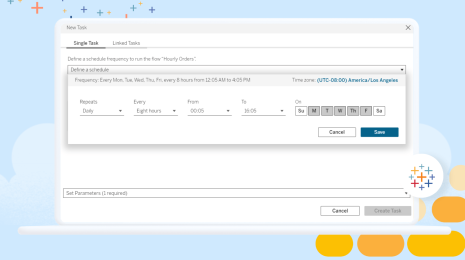
Tableau Prep Conductor Supports Custom Schedules
 15 mars, 2024
Abonnez-vous à notre blog
Recevez toute l'actualité de Tableau.