The Quantified Self: Measuring My Work/Life Balance


Note: This guest post by Tableau Zen Master Chris Love is part of our series on the quantified self. The first installment of our series outlined the trouble with dead-end dashboards. And the second part explored ways to quantify seemingly hard-to-measure parts of our lives like forgiveness, gratitude, and emotions.
The quantified-self movement has fascinated me for a long time. From my first step counter to poring over the Feltron reports, I’ve been inspired by the opportunities we have for an almost-constant understanding of ourselves through data. By understanding how much I eat and drink, how far I walk, and when I wake up and go to sleep, surely I can live a healthier, more productive life, right?
That’s not how it has worked in my experience.
Step counters, Fitbits, Wi-Fi scales, manual data recording, and many other ways of quantifying my habits have all fallen by the wayside in my life. Why? Because while they were new, I was keen to see the results and my habits changed as a result; I walked further and dieted more.
However, over time, as my habits regressed back to “normal”, these devices were left forgotten, uncharged, and unused. I believe the Hawthorne effect plays a huge part in any data collection involving individuals: If the individual is aware he or she is being measured, then he or she is likely to modify behaviour as a result. The two are inextricably linked.
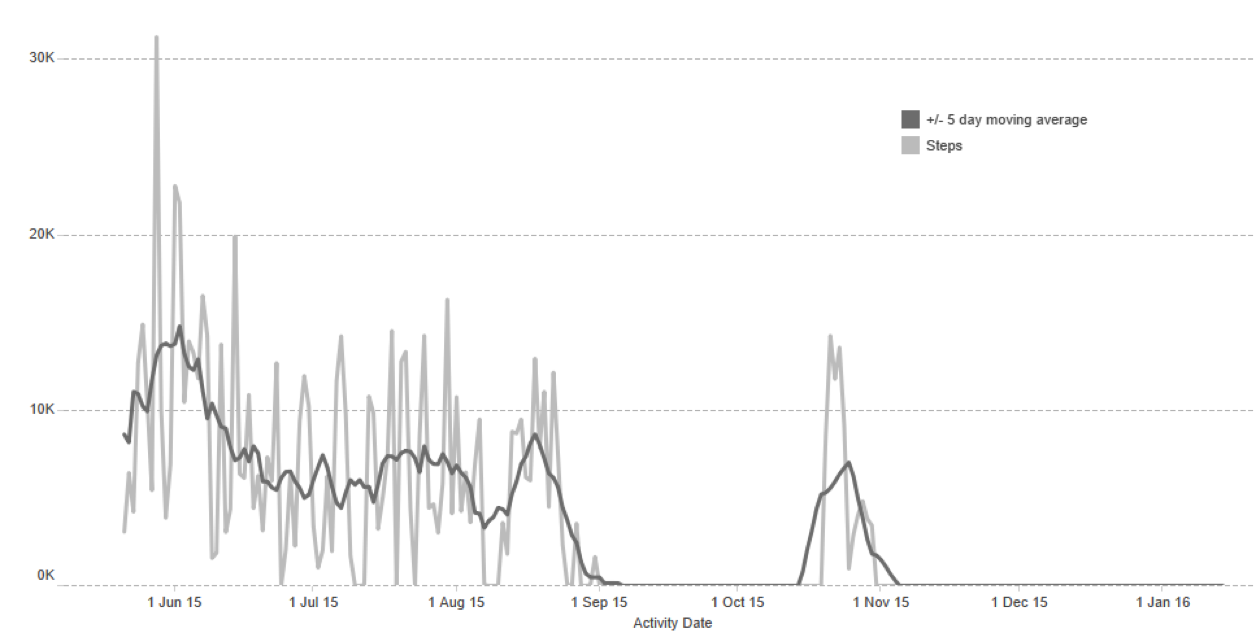
Like Andy Cotgreave’s, my Fitbit usage eventually petered out.
Was it a coincidence that my weight went down when I was recording my calorie intake? Was it a coincidence that my steps went up as I recorded them on my Fitbit? Of course not. Therefore, anyone undertaking a quantified-self study needs to undertake the measurement in such a way that it does not interfere with the activity itself.
An Invisible Measuring Device
While most of my attempts at QS haven’t stayed the course, there is data I’ve been collecting for a long time without doing a thing. This data is collected through my phone, a device I have charged and on me at all times.
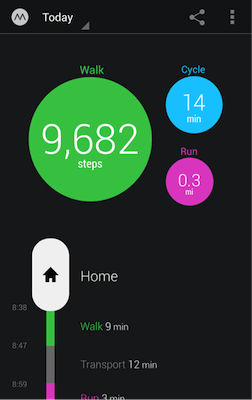 Just under two years ago, I installed Moves, an app which records my steps, activity, and location. It does so in the background without the user touching a thing. The focus of the app's interface is on a single day rather than any kind of trend analysis, which has meant that I barely engage with the app itself. It runs forgotten in the background, quickly removing any observer effect.
The interface provides a tiny fraction of what is possible from an app which records my location 24/7, especially since I travel a lot for work. How far do I travel from home? When do I leave home? When do I return? How often do I stay away from home? I’m fortunate enough to have an office at home, but am I at home enough as my two children grow up?
How do we begin to answer questions like that from an app like Moves? Firstly, we need to connect to the data using Tableau. For most situations. connecting to the data via a Web Data Connector (like the one built by my colleague Craig) will allow you to do exactly what you need.
But if you need to tweak or customise the data extract before using it in Tableau, you can export the data directly from Moves and tweak it in your favourite data-manipulation tool first (for me, this meant Alteryx). In my case, I used some initial data preparation to change the definition of “home” to a two-mile radius around my house, meaning a visit to the cafe or corner shop wouldn’t log me as leaving home.
Once I pulled the data into Tableau, I could tell where I was at any given time. However, to answer sophisticated questions like “When do I leave home?” I needed to add some extra calculations. For me, this meant writing a few Level of Detail Expressions. These calculations look across a set of data rows to find the first/last time I am not at the location.
For example, I can calculate “home” in a given day to give me the times I leave and arrive home. Also, if I don’t return home by the end of the day, then I can mark the day in the data with a new field I named “away from home”. Lastly, I can use sets in Tableau to group together annual leave and weekends to ensure I track when I am working versus when I’m not.
Armed with these calculated fields, I could then start to analyse my work/life balance over time:

Was I really spending the night away from home nearly 50 percent of the time in September 2014? Wow! And it certainly seems that 2015 was better for me in terms of spending more nights at home. However, does that translate to more time with my family?
Let’s look at how long I spend away from home when I’m only away during the day:

So while I’m home more often at night in 2015, it looks like I’m spending more hours away each day. This is hardly surprising given I’ve just changed roles at work. But this wasn’t something I was consciously aware of.
Let’s explore further:

Now we see the problem: 05:00 is the time I get up to go to London on the train. And I am also getting home after 18:00 on most days. If I want to spend more time with my family, then focusing on either being home before school or before bedtimes will help me be more consistently available.
What I’ve shown is a simplified analysis of how I’ve used Moves data to retrospectively check my work/life balance and check whether the balance is where I want it to be.
The Quantified Self: Measuring My Work/Life Balance
I can now go one step further and use location data in Moves to determine which trips I can combine in order to minimise the effect on my home life. Effectively, I can use Moves to monitor how often I am away in a given period and when I am returning home.
Here are a few keys lessons I’ve learnt through my QS journey:
- Choose a measuring methodology that does not impact your life.
- Be aware of the Hawthorne (“observer”) effect.
- Record data over a long period to ensure you have plenty of data to analyse.
- Don’t just rely on data provided by platforms; supplement it with calculated fields.
- Realise that measuring yourself is one thing; changing your habits are another.
The quantified-self approach is about collecting data and understanding yourself. But be clear on what you want to learn from the exercise. Like any data analysis, QS data without insight is just a list of numbers. Be sure to:
- Identify the questions you want to answer about yourself.
- Collect data to answer your questions.
- Translate the data, through analysis, into self-improvement and/or self-awareness.
What have you learnt through your quantified-self project? What data do you wish you could record? How have you evolved your life to be more data-driven? Share your ideas and thoughts in the comments below or with me on Twitter @ChrisLuv.
Abonnez-vous à notre blog
Recevez toute l'actualité de Tableau.