New in Tableau 8: 7 Reasons to Use Google Analytics + Tableau

So you're a web analytics junkie. Or you're at least web-analytics interested... And you've been using Google Analytics. The reporting console seems pretty good. No need to use Tableau, right?

Wrong. Google Analytics is a great free tracking tool, but if you rely on it for analytics you're leaving insight on the table. Tableau 8 has a direct connector to Google Analytics. Here are 7 reasons to use it.

Blend (aka mashup) data to show your website in context.

You can learn a lot from web analytics, but you can learn many times more when you blend your web analytics data. Demographics, sales data, product data-- all of these give you a different view into your business. This video shows what the Google Analytics connector in Tableau 8 along with a data blend can do.
  • Group to add another layer of intelligence.

    Simple things like analyzing web pages by section can be difficult in Google Analytics. Sure, you can do some simple things with text searches, but soon you're into Wild West Regex land. Tableau lets you create page groups simply, and use them throughout your analysis.
  • Filter to focus your analysis.

    In Tableau you can exclude sets of pages or entire groups-- something that's hard to do in Google Analytics reports. This lets you drill into different areas of your site. You can even make these filters dynamic and publish your report, so that others can decide on the fly what to include and exclude.
  • Make everyone your smartest analyst.

    Everyone has those killer analyses. Publish them up to Tableau Server. They'll get automatically updated through the Google Analytics API, so no more exporting data to refresh. And best of all, everyone will be able to use your best reports, right in a browser or on a tablet.
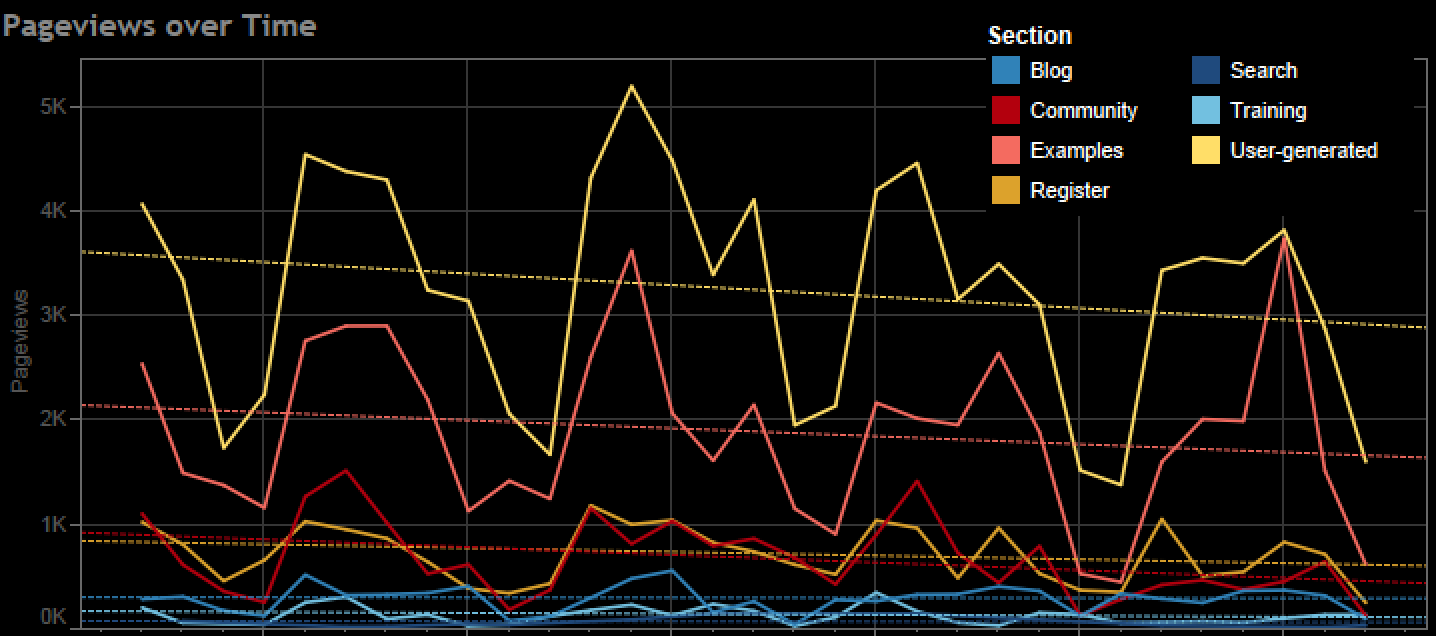
  • Use trendlines to, well, see trends.

    Simple things like trendlines can tell you a lot. Trendlines are even more powerful when combined with #2, grouping: Google-analytics-trendlines
  • Use Quick Calculations to turbocharge your analysis.

    In one click in Tableau, you can turn on powerful calculations: running total, percent difference, percent of total and more. These operations give you a second order of insight into what's going on in your website.
  • Do previous page/ next page analysis.

    Google Analytics can tell you a lot about goal paths. But when you get away from a goal, you don’t get much insight into where visitors are coming and going. Sophisticated analyses like previous page/ next page analysis can be a treasure of visitor information, and it's surprisingly easy in Tableau.

    Last tip: Google Analytics uses sampling, which means that ratios like bounce rate and exit rate can be very wrong when viewed in the aggregate. Always bring absolute measure (bounces, exits) into Tableau and calculate rates there. And GA has a 500,000 row limit for any one API call, so take extracts under the limit and then combine your extracts for the complete – and unsampled – picture.

    Download Tableau 8 (now in beta) to try these out for yourself (contact your salesperson if you need access). And watch this blog to learn more about Tableau + Google Analytics.