Another Inspiring Fanalytics - Part 2


This post is the second installment of a three-part series on Fanalytics 2018, a community event organized during Tableau Conference. The first post summarized the presentations given by our guest speakers, and the third post showcases materials from Fanalytics' first-ever newcomer workshops.
For the second year in a row, we dedicated a part of Fanalytics to discuss on topics dear to the community. But, we also reckoned that some of the Fanalytics attendees may not be as opinionated as our veteran vizzers, so we also decided to offer some introductory workshops on topics like basic web scraping, quantified self or storytelling. More on these workshops in the third post of this series.
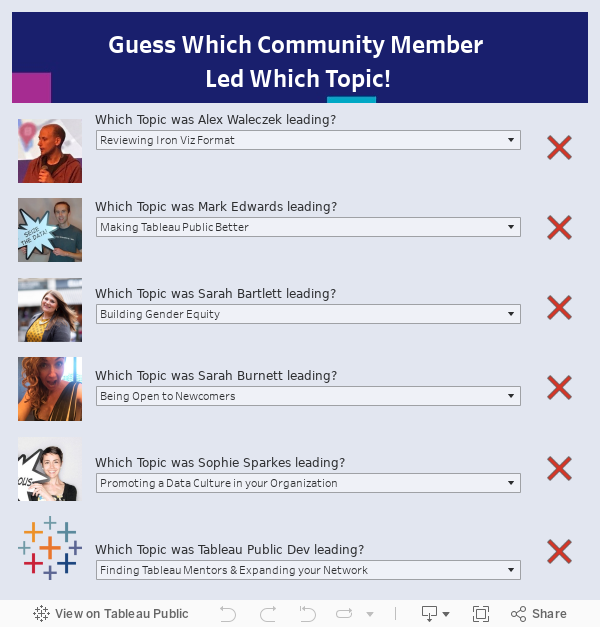
Thanks to a Google form posted on the blog a month before the event and the generosity of our blessed volunteers, we quickly gathered a fabulous team of Topic Leaders! With Sarah Bartlett, Sarah Burnett, Sophie Sparkes, Mark Edwards, Alexander Waleczek, and of course, the Tableau Public Dev team, we knew those discussions would go off without a hitch!
Now that you know our protagonists, let’s jump into a summary of those discussions. Navigate directly to the topics you feel interested in using this Table of Contents. And if you want to know the context our participants had, you can also check out the one pagers that kickstarted each conversation.
- Making Tableau Public Better - User feedback and suggestions
- Building Gender Equity - Making sure talented women are recognized
- Being Open to Newcomers - As individuals and as a community
- Reviewing Iron Viz - Changes made since last year and further improvements
- Promoting a Data Culture in your Organization - Spreading enthusiasm and data literacy
- Finding Tableau Mentors - Bringing the Tableau community to “real life”
Making Tableau Public Better
The objective of this discussion was for the community to share feedback and ideas with Tableau Public developers. Three representatives of our wonderful Tableau Public Dev team, Katie, Matt and Talia, sat at those tables in order to get first-hand feedback from users. The Tableau Public Dev team left with a valuable list of ideas and evidence that will help them assess priorities and impact, including the following:
- Providing more font options when publishing to Tableau Public.
- Equipping comments on vizzes. Some people would love viz commenting, while others envision extra work to moderate the comments. This is especially true for organizations publishing visualizations on Public.
- Giving authors the ability to reorder vizzes on their profile. Some argued that because Tableau Public is a portfolio of your work, your profile should be customizable. Others value the time-based ordering because it shows your progress and efforts over time.
- Improving search capabilities.
- Creating badges for authors who have received distinctions like "Viz of the Day" or "Iron Viz Top 10."
- Offering data sets of the day. Data collection and cleaning is usually the biggest hurdle of Tableau Public projects, so offering more data sets could help result in more publishing.
Building Gender Equity
This table was all about gathering ideas to continuously recognize talented women in the community and encourage new women to get involved. As gender biases around data start early, the group creatively suggested to involve the younger generations in the Tableau Conference by inviting groups of kids and students, and offering a kids track that would allow boys and girls alike to get familiar with data analysis and visualization.
With data people around the table, there was also a lot of thinking around the insight that Tableau Conference and Tableau data in general could contain. Would the level of sessions attended reveal a gender gap? Are women more likely to attend sessions with a female presenter? What was the brain dates (a new networking option in the conference app this year) performance like in terms of male and female participation? And more generally: what is the percentage of licenses that are sold to women?
As for the Tableau Public side of things, there were questions around the search function and whether improvements could make it easier to discover and connect with female authors. Knowing peer Tableau Public authors indeed helps women to stay engaged. Content curation and competitions were also identified as ways to shine the spotlight on women. This will remain an area of focus for the Tableau Public team in 2019.
Another great idea is to investigate your own gender biases. For example, see how Tristan Guillevin visualized the gender gap in who he follows on Twitter.
Being Open to Newcomers
These tables were all about sharing and remembering what it means to be a newcomer and determining ways we all can be more inclusive. The group came up with two main observations during the conversation.
- The language you use on social media matters!
- Serious barriers to entry exists for Tableau Public newbies.
In terms of barriers to entry, the most salient obstacles were the lack of a network to share one's vizzes with, the difficulty to find data sets, the fact that all discussions seem to happen on Twitter, and the difficulty to identify a newbie peer group. The group then built on these observations to suggest solutions. Having access to a structured starter pack with data sets ideas, a list of data initiatives and a dedicated area on the forum to introduce oneself could be a good starting point. Some of the ideas were similar to the ones discussed at the "Making Tableau Public Better" table. Commenting on vizzes may make getting feedback easier, being able to organize your Tableau profile with folders, categories, and a "Work in Progress" flag would help overcome the fear of hitting "Publish", while badges and gamification could motivate newcomers to grow their portfolio. Finally, in order to help newbies grow their network, tying Tableau Public more closely to the Tableau User Groups leadership and encouraging virtual brain dates would definitely help newcomers expand their network.
Like the badges idea? You can upvote it in the Community Forum thanks to Simon Beaumont! Read more about this discussion in Mark Edwards' notes.
Reviewing Iron Viz
This popular discussion aimed to review changes made since last year’s competition and suggest further improvements. The first point covered was judging and judges feedback. The possibility to receive feedback is greatly appreciated, but it was mentioned that having different guest judges for each feeder doesn't support consistency, and that without more context on how other participants compare, scores are difficult to understand and leverage for improvement. Incentives like Iron Viz badges on profile and recognition would also encourage people to join more feeders, yet the comeback of the "Crowd Favorite" prize was questioned as it felt to many that, in its current form, it is a popularity contest.
Another piece of feedback on the changes made to Iron Viz in 2018 was that the extended participation timeframe may actually go against the goal of encouraging more people to join. Indeed, some advanced users, with more time on their hands, might create even more elaborate visualizations and discourage first timers. Finally, the goal of Iron Viz itself was debated, as the Iron Viz Feeder Competitions and the Iron Viz Championship differ so much in content and output. Those are definitely questions that we will take home and think thoroughly about as we prepare for next year's Iron Viz.
If you want to read Sarah Bartlett's first-hand recap, you can check her personal blog.
Promoting a Data Culture in your Organization
This topic had an ambitious goal: identify what a “data culture” looks like in the wild, and how anyone who is part of an organization can help start or spread it. All the tables agreed that a data culture starts at the top, and that without management sponsorship, creating one is an arduous task. A data culture is also closely woven with a healthy company culture, which promotes communication and collaboration, data sharing (with proper governance and security standards in place), and open feedback.
The key actor in organizations aiming to create a data culture is the data advocate. As "change-consultants," data advocates identify the data needs of different areas of the business, offer solutions by iterating with users, and measure the progress in order to get further buy-in. To be successful in getting user adoption, they strive to create a community of users. This is done by offering training, sharing inspiring material, encouraging peer learning opportunities with activities such as company Viz Games or live #MakeoverMonday sessions, and more generally, being available to answer questions and help users ramp up. Providing clear dashboard guidelines and encouraging simplicity are also tips that were shared by some participants.
If you are interested in this topic, you may want to check the Tableau Community Toolkit for organizations.
Finding Tableau Mentors
Participants of this discussion explored what mentorship looks like in the community and how to become a men(tor|tee) to someone. It all started with the observation that mentoring relationships can take different forms, ranging from ad-hoc, short-term advice-seeking to long-term career building. Mentorship might also be more focused on non-technical topics and function as life-coaching where the mentor helps the mentees by removing roadblocks, building confidence, and holding them accountable for promises and deadlines. Yet most people tend to look up to experts and leaders, and don't realize that they are the expert of someone else, and could share and teach to average users. Additionally, an individual can be a mentor and a mentee to the same person or to various people at the same time, and even though the mentoring relationship appears to benefit mostly the mentee, the mentor also learns and grows through it.
A problem that was mentioned repeatedly is the accessibility of “the community”. Many of our participants noted that it isn't necessarily clear you could become part of it. Further, there's some question as to what the community actually is. Suggestions for improvement involved better communication once a Tableau license is sold in order to tell people about Community Forums and Tableau Public, similar to the starter kit suggested by the "Being Open to Newcomers" group. Suggestions to grow mentoring in the Tableau community included featuring men(tor|tee) success stories in blog posts, creating a "Supported By" field on Tableau Public similar to the "Inspiration" field, and having Mentor Ambassadors on top of the existing categories. The MentorCity enterprise platform to facilitate contacts between potential mentors and mentees was also introduced by a participant as a possible model.
You can read Alex Waleczek's recap on his personal blog. His post includes the recording of Mike Cisneros and Alicia Bembenek's TC session titled "The Benefits of Finding (and Being) a Tableau Mentor".
Now you know what's hot in the Tableau Public community! But do you have a Tableau Public profile? Create your free Tableau Public profile today, and it might take you on a journey from being a newcomer to finding a mentor, and who knows... you may end up competing in Iron Viz one day!
Tableau Public is—and always will be—for you, which is why we're always striving to get your opinions and feedback! If you have more ideas and want to continue the conversation, reach out to us on Twitter @TableauPublic or email us at public@tableau.com.
Articles sur des sujets connexes

Meet Iron Viz 2024 Finalist Jessica Moon
 avril 15, 2024

Meet Iron Viz 2024 Finalist Pata Gogová
avril 8, 2024

Student to BI Analyst, How Tableau Can Lead to a Successful Data Career
 mars 20, 2024
Abonnez-vous à notre blog
Obtenez les dernières nouvelles de Tableau dans votre boîte de réception.