Building the ISS tracker using JSON and Tableau JavaScript API


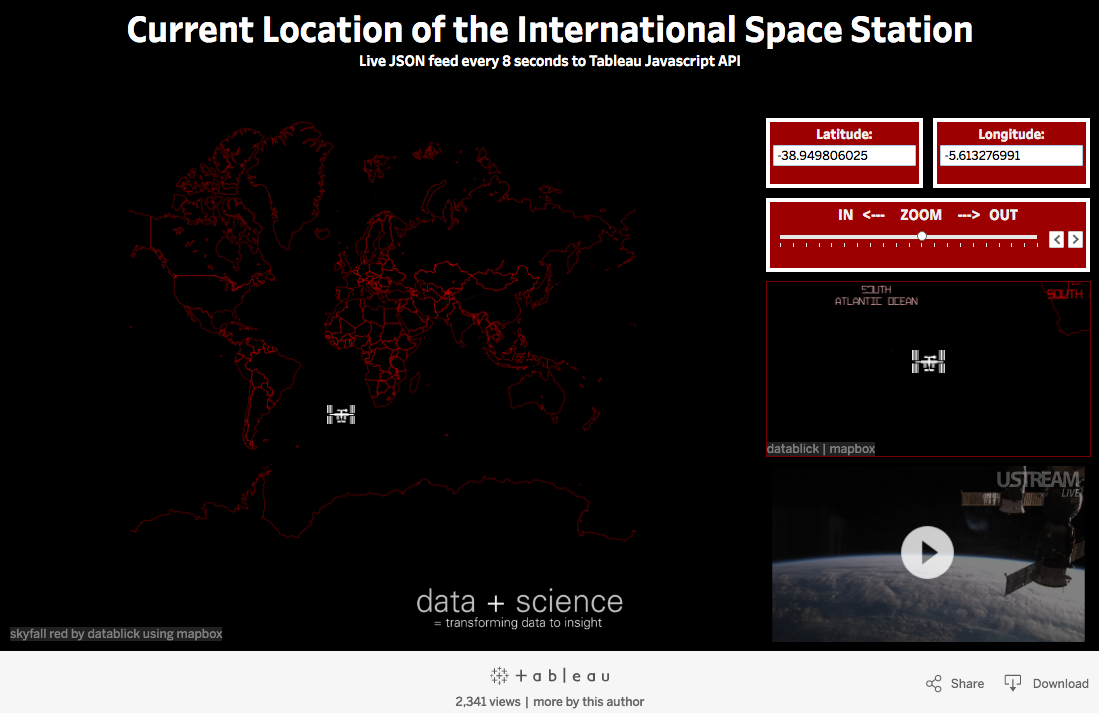
Click to visit the live tracker which updates every 8 seconds.
Note: The following is a guest post by Tableau Zen Master Jeffrey Shaffer.
A few weeks ago, I created a viz that tracks the position of the International Space Station using a live JSON feed and the Tableau JavaScript API.
Building this visualization requires a bit of coding, HTML, Javascript, and AJAX, but the code is very short and very straightforward. Below is an outline of the code as well as a description of how it works and how it's set up so you can just copy and paste.
1. Build a Tableau viz
The first step is creating a Tableau visualization that plots a point on a map using a parameter. This requires two parameters and two calculated fields.
- Create a new parameter called Lat and use the default floating format. Set the starting value at 39.123.
- Create a new parameter called Long and use the default floating format. Set the starting value at -84.51.
- Create a new calculated field Latitude and set it equal to the parameter [Lat].
- Create a new calculated field Longitude and set it equal to the parameter [Long].
- Right-click on Latitude and set the "geographic role" to Latitude.
- Right-click on Longitude and set the "geographic role" to Longitude.
- Place Longitude on Column and Latitude on Rows.
You should now have a visualization that plots a point on a map in Cincinnati, Ohio. Pretty simple, right? Just two quick parameters and two calculated field. Now style the visualization as you wish and publish it to Tableau Public.
Optional step: Find a Space Station icon to use as a custom shape.
2. Get the JSON data
NASA maintains a live JSON feed that provides the current location of the International Space Station.
The data that returns looks like this:
{
"iss_position": {
"latitude": 30.618402747184426,
"longitude": 153.91510275732745
},
"message": "success",
"timestamp": 1473466435
}
Using a basic HTML page, the code below retrieves the latitude and longitude from this JSON feed and stores them in the variables Lat and Long.
<script>
function getValue() {
			var res;
            $.ajax({
                type: 'GET',
                dataType: 'jsonp',
                url: 'http://api.open-notify.org/iss-now.json',
                async: false,
                crossDomain: true,
                complete: function (data) {
                    if (data.readyState === 4 && data.status === 200) {
						Lat = data.responseJSON.iss_position.latitude;
						Long = data.responseJSON.iss_position.longitude;
						LatLong(Lat,Long);
                    }
				}
			});
        }
</script>
The last line of the code above is LatLong(Lat,Long). This calls a JavaScript function that passes the values into a Tableau workbook parameter. I will create that function as the last step below.
Note: Because of the 'jsonp,' it is very important that the Tableau function is called inside the GetValue function.
3. Set up the Tableau viz and JavaScript functions
I recycle code over and over again to set up Tableau visualizations for the JavaScript API. There are a number of resources available in my Tableau Reference Guide under the section on JavaScript API that will help you get started. The code is pretty straightforward and is outlined in detail here.
Note: The JavaScript API library and the AJAX library have to be called, which you will see in the <head> tag below.
The code below creates a workbook variable and three additional variables for a placeholderDiv, the URL, and options. Once those are all created, the last line of code puts it all together: var viz = new tableauSoftware.Viz(placeholderDiv, Url, options);
onFirstInteractive sets up the workbook, and getValue is the functon we created above to get the very first reading of the latitude and longitude. I call the function so that the viz updates the ISS position immediately after it loads. var viz = new tableauSoftware.Viz(placeholderDiv, Url, options); puts all the pieces together for the JavasScript API using the variables that were just set (placeholderDiv, Url, options). I added window.setInterval("getValue()","8000"); which refreshes the browser every 8 seconds.
Note: The URL needs to be set to read your Tableau Public viz. The format of the URL is:
https://public.tableau.com/views/[VIZ NAME]/[WORKSHEET NAME]?:showVizHome=no
<head>
<script src="https://public.tableau.com/javascripts/api/tableau-2.0.0.min.js" type="text/javascript"></script>
<script src="https://ajax.googleapis.com/ajax/libs/jquery/2.1.4/jquery.min.js"></script>
</head>

<script>
var workbooka;
var placeholderDiv = document.getElementById("tableauViz1");
var Url = "https://public.tableau.com/views/ISStracker/ISSLocation?:showVizHome=no";
var options = {
	hideTabs: true,
	hideToolbar: true,
	width: "100%",
	height: "100%",
	onFirstInteractive: function() {
		getValue();
		workbooka = viz.getWorkbook();
	}
};

var viz = new tableauSoftware.Viz(placeholderDiv, Url, options);
window.setInterval("getValue()","8000");

function LatLong(a,b) {
workbooka.changeParameterValueAsync("Lat", [a]);
workbooka.changeParameterValueAsync("Long", [b]);
}

</script>
The last step in the code above is creating a function that passes the parameters to a Tableau workbook. In step 1, we created two parameters in Tableau, one for Lat and one for Long. The function LatLong(a,b) creates a function that changes the workbook parameters using workbooka.changeParameterValueAsync("Lat", [a]); and workbooka.changeParameterValueAsync("Long", [b]);.
Remember, this function is called above as the last line of code in the GetValue function. In other words, after the GetValue returns the latitude and longitude of the Space Station and holds them in variables, then it calls this functions to pass them to Tableau into the parameters that are set up.
You now have all the code you need to control your viz. You can add some additional styling of the webpage background color and CSS styling of the viz as you see fit. Here's what the finished code looks like.
<html>

<head>
<script src="https://public.tableau.com/javascripts/api/tableau-2.0.0.min.js" type="text/javascript"></script>
<script src="https://ajax.googleapis.com/ajax/libs/jquery/2.1.4/jquery.min.js"></script>
</head>

<body bgcolor="#000000"; onload=getValue();>
<br>
<center>
<div id="center1"><center><div id="tableauViz1"></div></center></div>
</center>

<script>
function getValue() {
			var res;
            $.ajax({
                type: 'GET',
                dataType: 'jsonp',
                url: 'http://api.open-notify.org/iss-now.json',
                async: false,
                crossDomain: true,
                complete: function (data) {
                    if (data.readyState === 4 && data.status === 200) {
						Lat = data.responseJSON.iss_position.latitude;
						Long = data.responseJSON.iss_position.longitude;
						LatLong(Lat,Long);
                    }
				}
			});
        }
</script>

<script>
var workbooka;
var placeholderDiv = document.getElementById("tableauViz1");
var Url = "https://public.tableau.com/views/ISStracker/ISSLocation?:showVizHome=no";
var options = {
	hideTabs: true,
	hideToolbar: true,
	width: "100%",
	height: "100%",
	onFirstInteractive: function() {
		getValue();
		workbooka = viz.getWorkbook();
	}
};

var viz = new tableauSoftware.Viz(placeholderDiv, Url, options);
window.setInterval("getValue()","8000");

function LatLong(a,b) {
workbooka.changeParameterValueAsync("Lat", [a]);
workbooka.changeParameterValueAsync("Long", [b]);
}

</script>

</body>
</html>
I hope you find this information helpful. If you have any questions, feel free to email me at Jeff@DataPlusScience.com.
For more tips, tricks, and vizzes by Jeff, check out his Tableau Public profile page and his blog. You can also connect with him on Twitter @HighVizAbility.
Articles sur des sujets connexes

How to Embed a Data Viz from Tableau Cloud into Your Google Docs
 août 16, 2023

Intro to the Salesforce Developer Universe
 mai 5, 2023

Calling all Tableau Developers for TrailblazerDX 2023
 février 1, 2023
Abonnez-vous à notre blog
Obtenez les dernières nouvelles de Tableau dans votre boîte de réception.