How I Went from Air Force Officer to Tableau Zen Master


Note: The following is a guest post by Tableau Zen Master Robert Rouse. This post first appeared on the InterWorks blog.
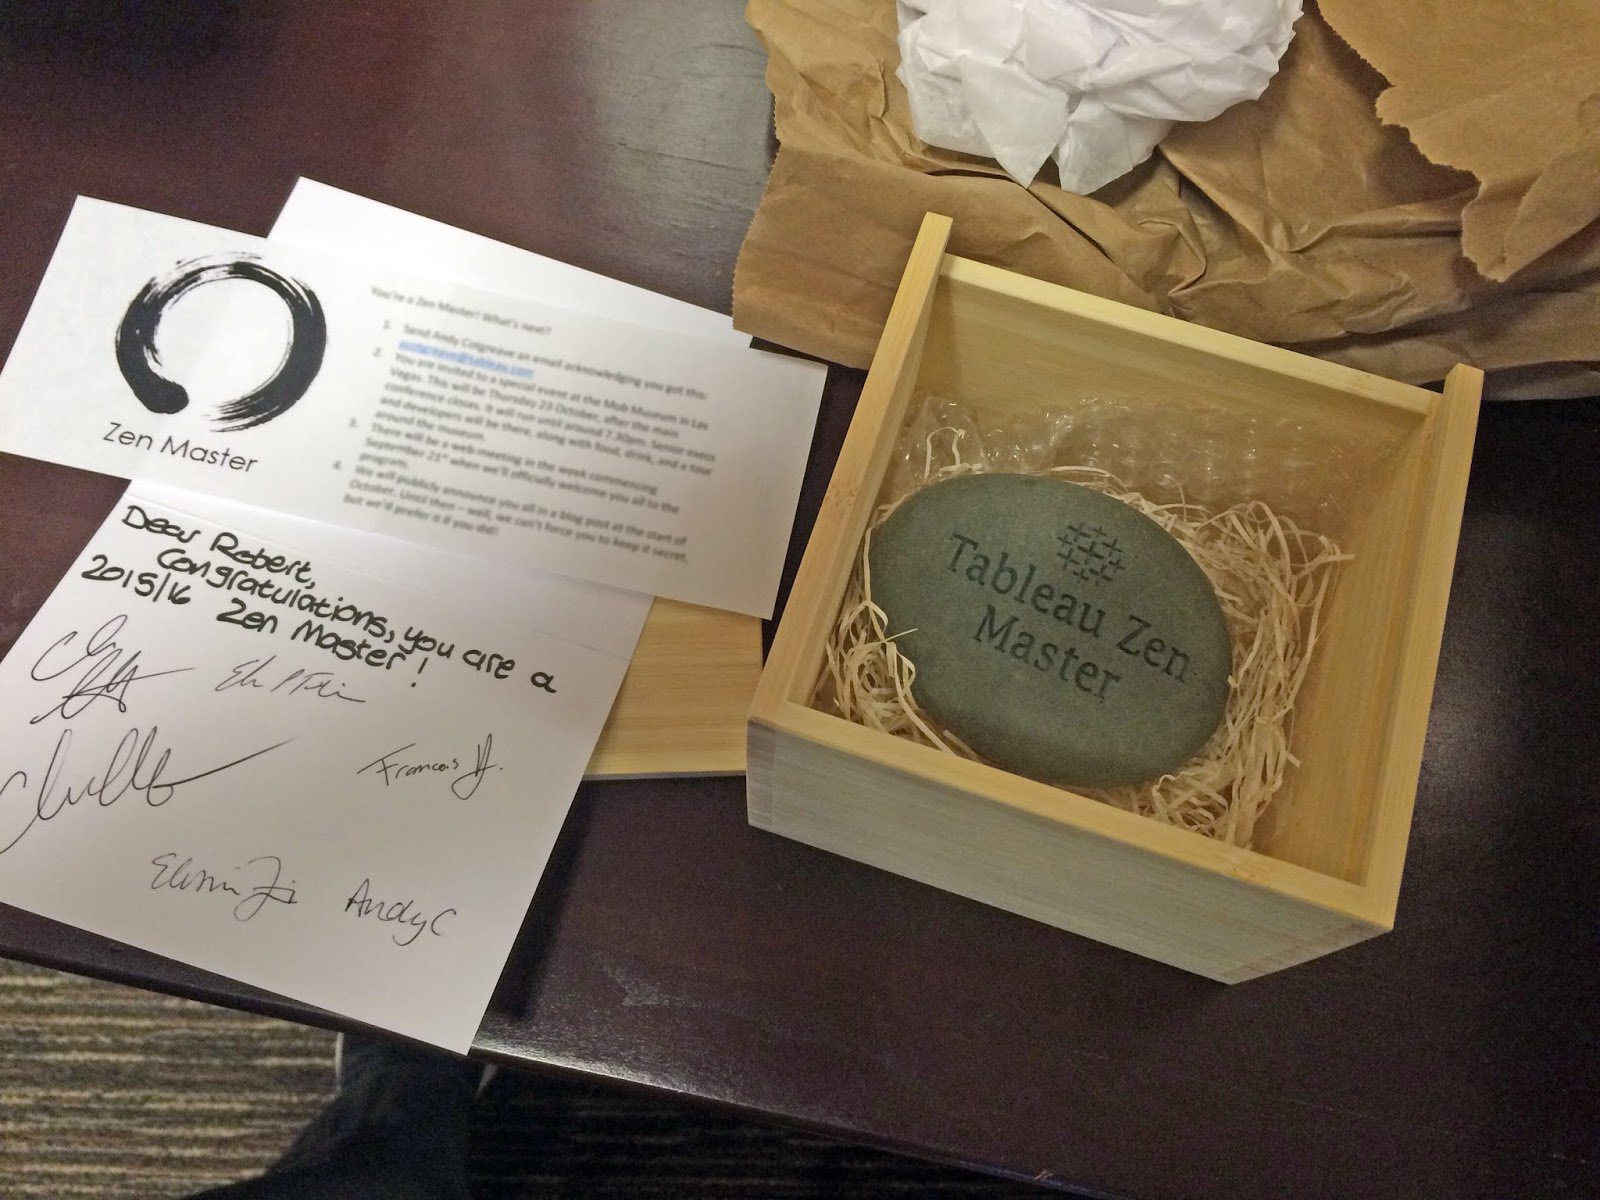
I wasn’t expecting anything special to happen on a particular Tuesday in September. Then I got a note saying there was a package waiting for me. It was from Tableau. I knew that Tableau Zen Masters could be announced soon, so I rushed through Dallas traffic to get there before everyone would be gone for the day. With 10 minutes to spare, I opened the package to find this:
You may think that’s the day everything changed, but I’ve learned from other Zen Masters that it doesn’t change what defines them: a passion for data and an eagerness to share it with others. A natural question people may ask is, “What makes you a Zen Master?” I can only answer that by telling the story of how I got to this point.
Data on the Base
My journey started in Japan at Misawa Air Base, where the US Air Force is co-located with the Japan Air Self-Defense Force (JASDF). My first on-the-job introduction to working with databases was reporting information about Japanese government-funded projects and US government-funded projects. Those were the very definition of “disparate” data sources. I had just graduated from the Air Force Academy where my mechanical engineering degree included just one computer science class with a very short section on Microsoft Access. I had more learning to do, and fast.

Robert, second from left, is seen in uniform.
We had a group of experts down the hall attaching information to an online base map. They showed me most of the basics. They helped me work through data about base housing occupancy, aircraft landing delays, physical fitness test results, and more. By the time we deployed to Iraq, I had enough experience under my belt to apply those new skills to a database that tracked the building and repair work we were there to accomplish.
Data Everywhere
By the time I left the Air Force, I was seeing almost everything as a situation that could be improved with skillful data wrangling. When our work order system couldn’t track customer priorities, I linked it with Access and joined it to an editable table. Where some people saw an array of heavy construction equipment to manage, I saw rows and columns with engine hours, maintenance status, and billing rates. Where others see just the text of the Bible, I see network diagrams, lat/long coordinates, and timelines. If we needed to model the impact of a business decision, I would gather up data from every silo that could be related.

Most people I encounter don’t think like that. Tableau is a tool that helps me communicate data to them the way it exists in my brain. In meetings, analysis discussions change from a glazed-over look to active engagement as soon as we put Tableau on the screen. People ask questions and see them answered right away instead of hearing, “I’ll get back to you later”—how exciting!
Data All the Time
While I had spent a lot of time working through problems that way, it was only part of my job. But it was the part that I loved the most. My director described this perfectly when he said, “I see an engineering problem with a data aspect. You see a data problem with an engineering aspect.” He was right. At heart, I wasn’t an engineer; I was a data geek. So I set out to make it my primary role rather than a secondary one.
That led me to InterWorks. Four years of using Tableau taught me a lot, but it was clear that there was just as much to learn then as when I started on that very first database project in 2003. One of my first blog posts was about what makes InterWorks different, and I knew early on that it would be a place where people like me can thrive.
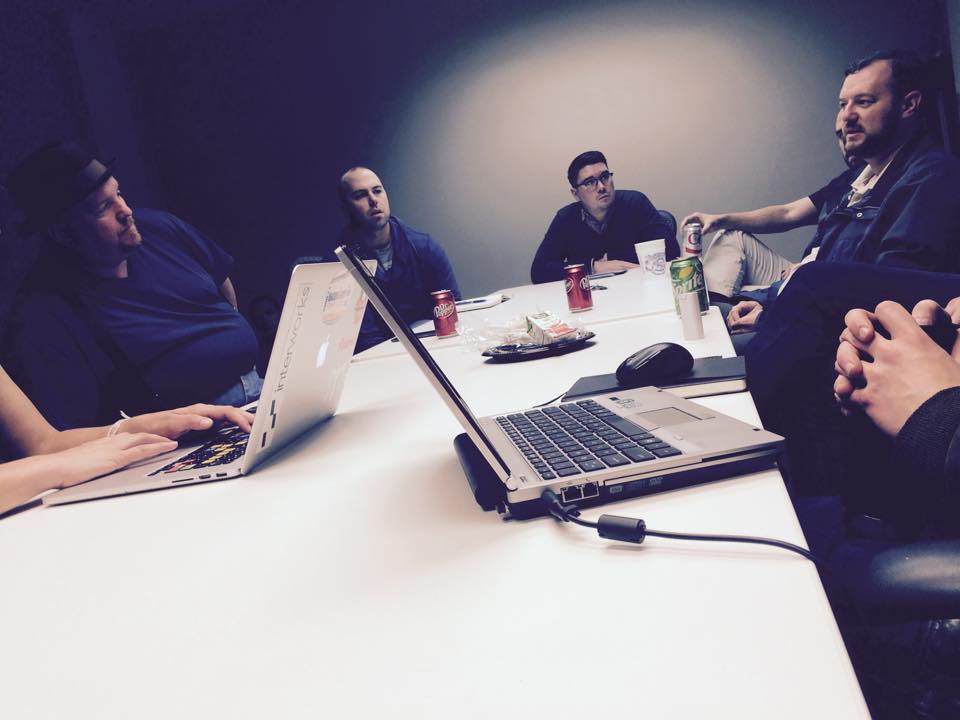
Robert, right, is seen with his team.
That’s when I really hit my stride with Tableau. Helping people with new challenges or finding new ways to solve old problems is exhilarating. When I get stuck, there is a team of creative people here with a wide range of skills and backgrounds who share what they’ve learned along the way. How that dynamic accelerates learning is one of the biggest factors in my growth in working with data this past year. I couldn’t be more appreciative of it.
What Now?
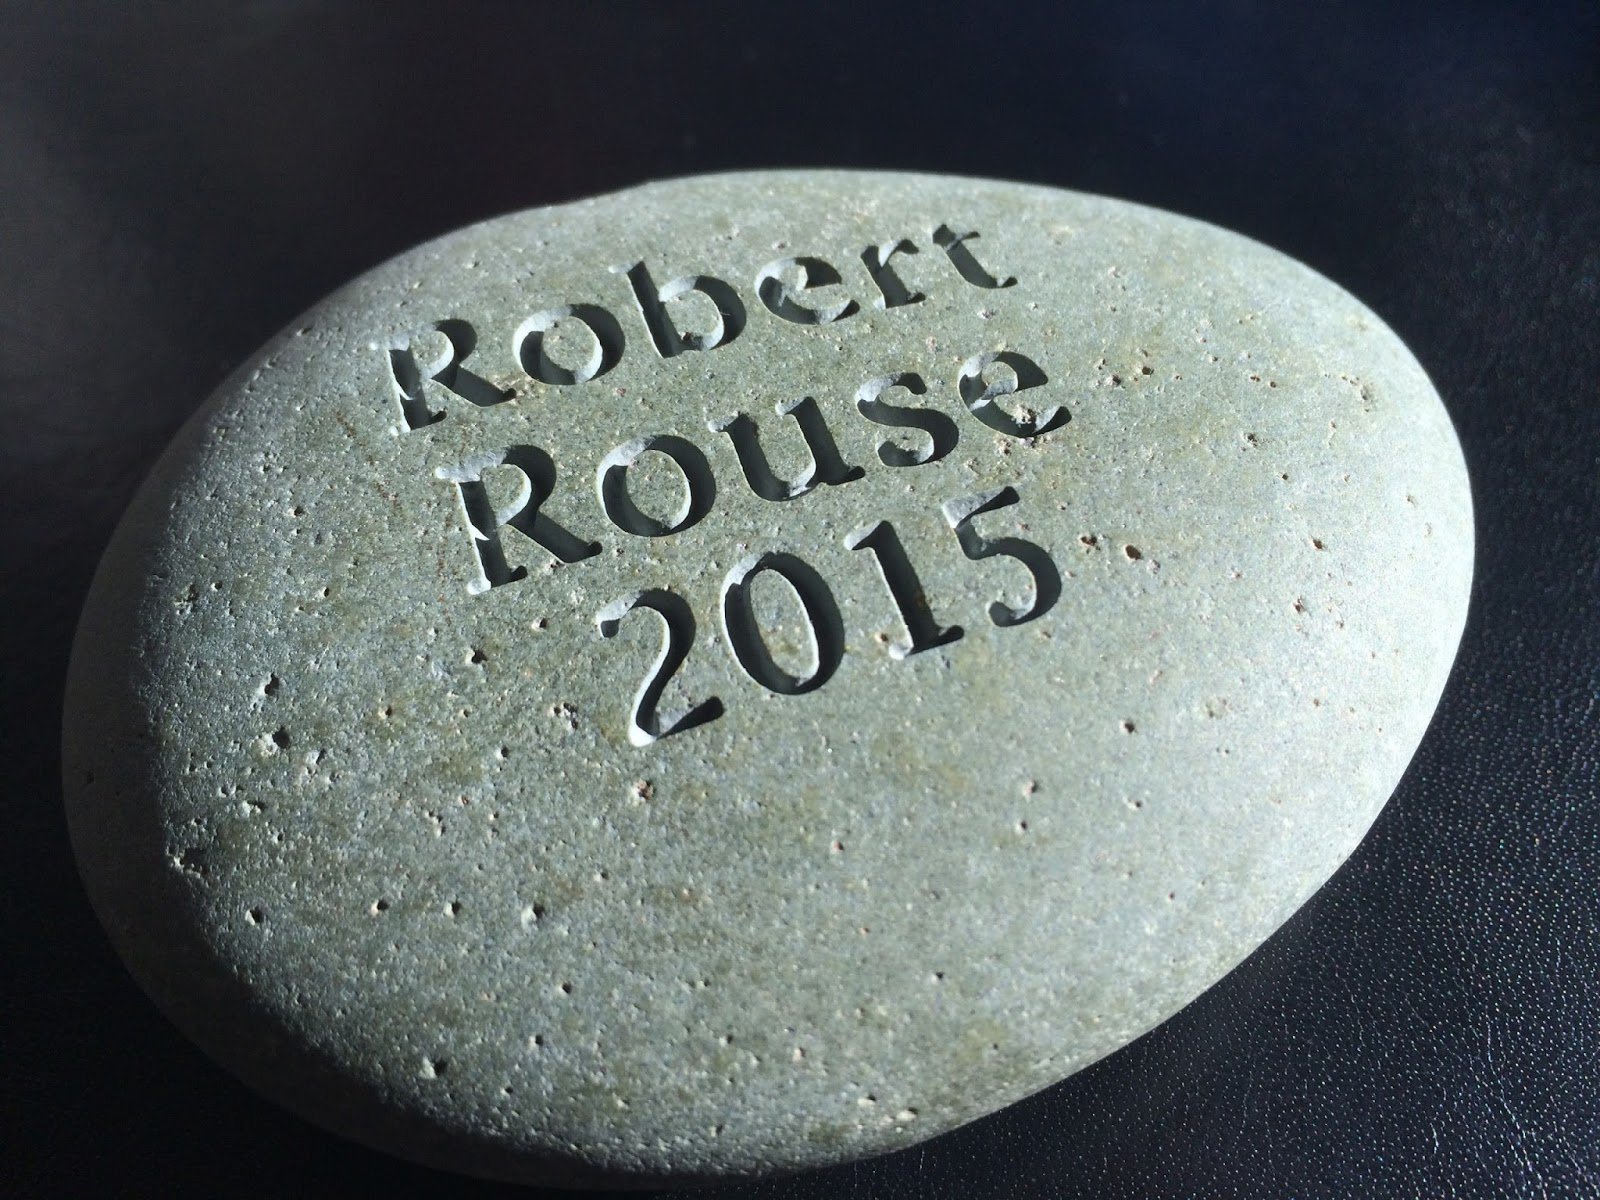
Does having my name etched on a rock change anything? It does and it doesn’t. What may change is the scope of opportunities there will be for me to share my passion with other people. When I started consulting, someone told me, “No one cares if you’re a rock star. They care if you can make them a rock star.” The Tableau Community, my friends here at InterWorks, and other Zen Masters exemplify the sentiment behind that statement. I’m grateful for their generosity, which has helped me learn so much. I want to pay it forward by doing the same for others. That will be true whether or not there’s a rock on my desk.
Abonnez-vous à notre blog
Obtenez les dernières nouvelles de Tableau dans votre boîte de réception.