See all of 7.0's features in detail here.

New Ways of Seeing
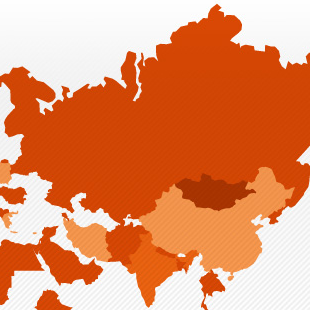
Tableau 7.0 kicked things off with new native visualizations: filled maps and area charts. Both just take one-click to display your data in a beautiful way, whether it's presenting geographic data or dissecting individual changes within trends over time.
But it wouldn’t have been a major release without improving existing features and making them easier to use, such as a redesigned Menu. Or maps that now wrap. Or how about our signature 'Show Me' feature? It's now a dynamic experience, actively suggesting chart types based on the data fields as you select them. It's also an exploratory experience, meaning you can switch between different views on the fly.
And then there's better geocoding. Ever have data that has GB, Britain, UK and a dozen more permutations of the same country? Now they all automatically point to the same place. Always.

Analytical Firepower
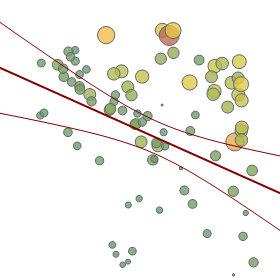
What would a new release be without more powerful ways to see and understand your data? With 7.0, we invited a host of new analytical tricks to the party, such as confidence bands, exponential trend models and deeper summary stats.
We also made a number of improvements to already existing features. Tooltips were enhanced with new action-buttons to keep you moving and analyzing your data at the speed of thought. Dates became easier to work with, including some better formatting customizations and even the ability to show dates with no data. And parameters are now just one click away when you want to let the user control reference lines, top N filters and bins.
For many of you, Tableau is about speed. How could we disagree?

The Data Server
As data grows in your organization, you need a good way to keep all those data connections, extracts and other files organized. The new data server in 7.0 is here to help, providing a one stop shop for centralized data management.
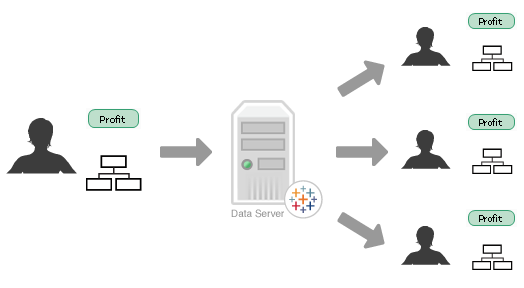
This means streamlined metadata. Rename a field, create a calculated field or build a hierarchy. Now, when other users connect to that data, they'll see the exact data as you cleaned it: the same field names, the same calculations, the same--you get the idea. And when you update that data, it will update for everyone else. One version of the truth.
The data server can also store data connections, acting as a proxy between users and databases, which IT will love--no need to install drivers on everyone's machines? Yes, please.
And of course, this is still Tableau Server, which means it's as secure as ever. All data connections will respect any security settings you set, whether in Tableau Server or the database itself. Published data sources can also be secured on a user by user basis.

Multi-tenant Server
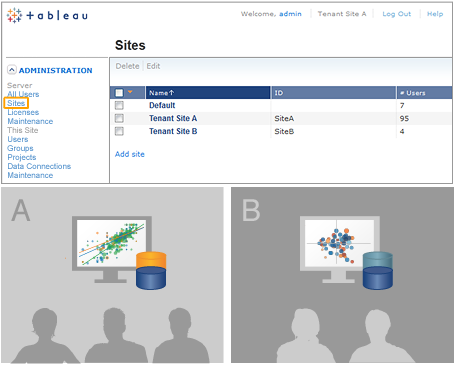
Multi-tenancy allows Tableau Server to be segmented into separate sites, separating workspaces, content, users and workbooks--all while still using one instance of Tableau Server. Members of one site won't be able to view content from other sites.
If you serve reports to multiple clients via Tableau Server, you don’t want them to be able to see each other’s workbooks, users or projects. In fact, you probably don't want one client to even know the other even exists.
Just one more vote for privacy and security in this digital information age.