
Build your Tableau Conference agenda to choose your own data-venture. Register today.

Best data event of the year? Abso-data-lutely.
Grab a dashboard and join the DataFam at the industry's leading analytics conference. If you love data — and you want to discover what's next for AI — Tableau Conference is the place to be.

Learn
Three days packed with 200+ breakout sessions, 60 hands-on trainings, keynotes, community-led learning, training and certification add-ons, and more.
Connect
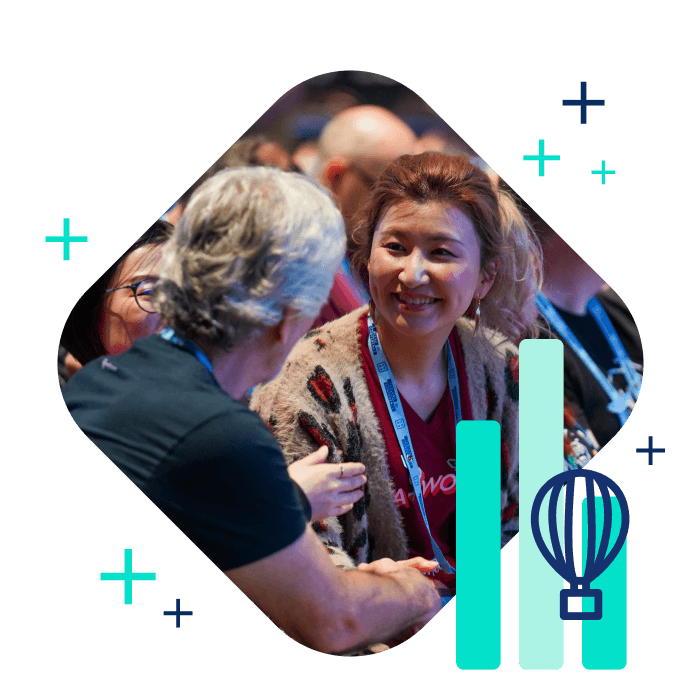
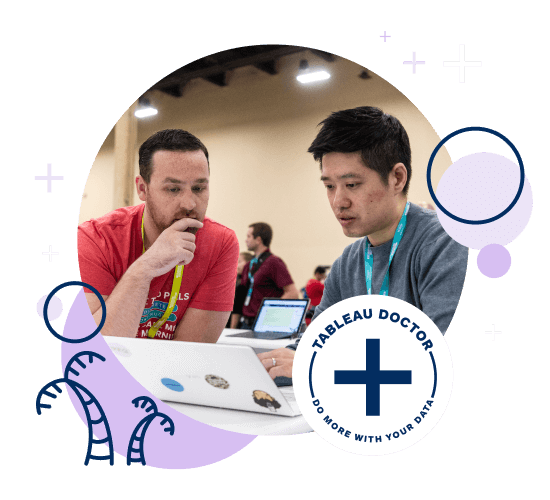
Everyone is DataFam at Tableau Conference. Connect with the broader data community — from exploring Data Village to Tableau Doctor diagnostics.

Have fun
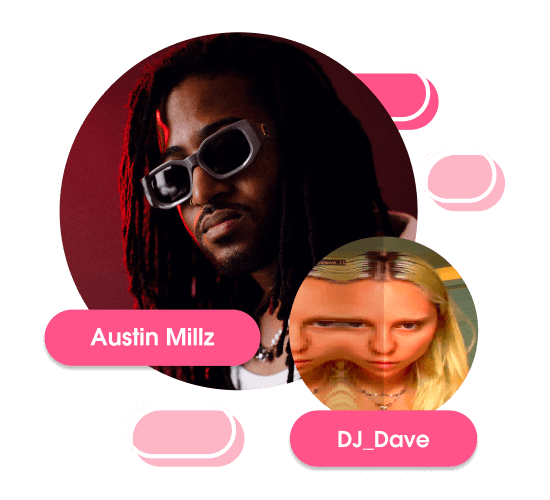
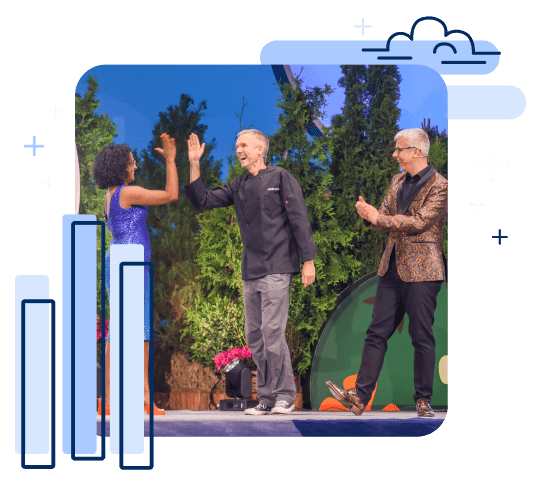
Get pumped for DataFam favorites like Iron Viz and Data Night Out, plus all the fun you expect from Tableau Conference.

Give back
Do good data. Share your Tableau skills and learn how to use data to create meaningful change.
These data experts top the charts.
Hear from Tableau and industry experts, thought leaders, and top brands to discover how organizations like yours are driving innovation and impact with data and AI.

Ryan Aytay
President & CEO, Tableau
Salesforce

Southard Jones
Chief Product Officer, Tableau
Salesforce

Elizabeth Maxson
Chief Marketing Officer, Tableau
Salesforce

Padmashree Koneti
SVP Product Management
Salesforce

Walid Mehanna
Chief Data & AI Officer
Merck KGaA

Davy Moore
AVP, Business Intelligence
SCOR

Kristin Prautzsch
Senior Director, Data Strategy & Analytics
NBA

Joe Taylor
SVP Revenue Analytics
Live Nation Entertainment


Make the most of your time at TC24.
Regular programming runs Monday, April 29–Wednesday, May 1. Stay Thursday and Friday (May 2–3) for Tableau Bootcamp.
Pro tip: Arrive Sunday, April 28 for badge pickup, registration, and other preconference fun.
Monday
April 29
Data Village
Tableau Doctor
Breakout Sessions
Hands-on Trainings
Tableau Certifications (add-on)
Tuesday
April 30
Keynote
Iron Viz
Data Village
Tableau Doctor
Breakout Sessions
Hands-on Trainings
Data Night Out
Wednesday
May 1
Product Q&A with Tableau
Leadership
Data Village
Tableau Doctor
Breakout Sessions
Hands-on Trainings
Thursday, May 2–Friday, May 3:
Tableau Bootcamp (optional two-day add-on)
Tableau Conference is for data lovers everywhere.

Data Analysts
Learn and connect with your DataFam — reunite with old friends and see new faces. Refine your data skills, dive deep into specific analytics use cases and Tableau features, expand your network, and learn how others are making waves with data.

Data and IT Leaders
Explore how you can empower your teams to make better, faster decisions with data. Connect with your peers at all stages of their data journeys and learn how they are riding the data wave and maximizing the value of data across the organization.


Tableau Conference is truly one of a kind. It’s where people come together to learn, connect, and shape the future of data.”
Christopher Scott | Tableau User Group Ambassador
Tableau Conference, quantified.
2
Keynotes
200+
Breakout Sessions
60+
Hands-on Trainings
1
Data Event
to Rule Them All


Certification
Make your data skills Tableau official.
Choose from one of four Tableau Certification exam add-ons and return from Tableau Conference with proof of your expertise:
- Tableau Certified Desktop Specialist
- Tableau Certified Data Analyst
- Tableau Certified Consultant
- Tableau Certified Architect
Certification exam sessions will be held on Monday, April 29. Seats go fast, so sign up today. If you’ve already registered, you can log back in to the attendee portal and add the exam session to your program.
Get more value from your data with our sponsors.
Innovators
Groundbreakers

