Subject Area: UI
Level of complexity: Beginner
Approximate Time to complete: 1 Hour
Companion Workbook (twbx): ShowMeAsMacro.twbx
Additional Resources on the web:
- http://www.tableau.com/whitepapers/show-me-automatic-presentation-visual-analysis
- http://kb.tableau.com/articles/knowledgebase/automatic-show-me
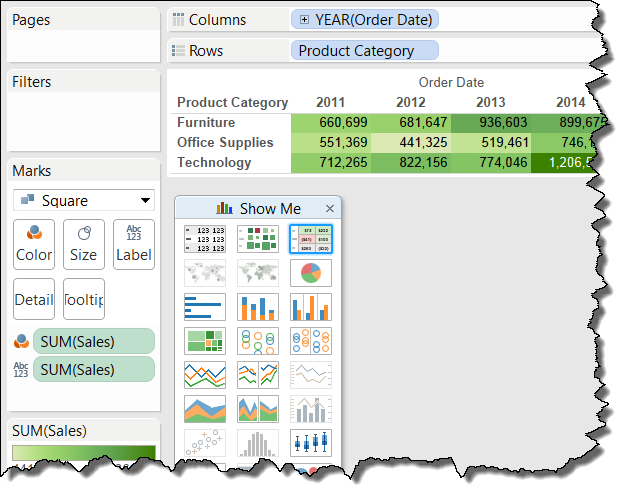
Tableau comes equipped with a feature function called ‘Show Me', which seeks to teach and enable users to employ recommended visual Best Practices. Show Me automatically highlights appropriate chart types for the data displayed or selected, and even makes a recommendation based on selections.

Show Me is the best way to learn how Tableau interacts with a given number of dimensions and measures. It seeks to ‘automate presentation' in that they are set, predefined views from where a Tableau user can start their analysis. As Show Me simplifies the proverbial jumping off point for a user's analysis, many users consider it a useful ‘macro' in specifying the rules or patterns for displaying their data.
Show Me is able to both author a view or pivot it according to the data already displayed within the view.

Some users will ‘grow out' of Show Me, and instead create visuals in the more manual manner of dragging and dropping all dimensions and measures. However, for certain chart types that incorporate much more formatting and other features (reference lines, many different types of marks) of Tableau, Show Me is the easiest option in order to originally render the visual. Some of these chart types are: Bullet Graphs, Gantt Charts, Histograms, or Box Plots. Even creating a simple crosstab becomes easier using Show Me, being that new users of Tableau often do not fully understand Measure Names / Measure Values and the text shelf.
Any views that are created with Show Me are then customizable using any other dimensions or measures a user wishes by further dragging and dropping accordingly. This iterative customization is most often done by splitting the view using another dimension in order to create a ‘small multiples' view!