How to do proportional highlighting with set actions in the latest Tableau beta


It's nice to get back involved in Makeover Monday. This week Andy and Eva teamed up with The Economist's data team to tackle the recently relaunched Big Mac Index. I'm a big fan of the interactive version; the original version appeared in my book, The Big Book of Dashboards.
This week also coincides with another Tableau beta release (2018.3) with many great new features—go download it! The two I am very excited about are set actions and transparent images. The former allows us to quickly and easily implement proportional highlighting, and the latter opens up a new world of design options.
First of all, what is proportional highlighting? It is a method of interacting with data. When you select some marks in one view, instead of filtering other views, the other views show the proportion of the selected items in relation to all items. For a highly detailed look, check out Stephen Few's article from 2010. And here’s an example of how proportional highlighting can work in Tableau:

Looks good, right? How do we do it? In my example, I want to use a chart showing Big Mac prices in all countries, and then highlight specific ones in the chart showing total cost of Big Macs over time. Yes, it's quite an artificial premise, but I was building this to experiment with the new features!
Let's get started
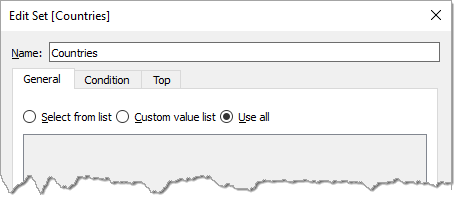
First, create a Set using the [Country] Dimension. You can hardcode some conditions, or just "Use All". Note: The dashboard action will update the set contents, but when the action clears, it will reset to the defaults you set here.
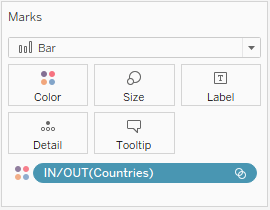
Next, add the set to each view you want to connect together in the dashboard: Drag the set to the colour shelf. It will default to showing in/out, which is what we want in this case.
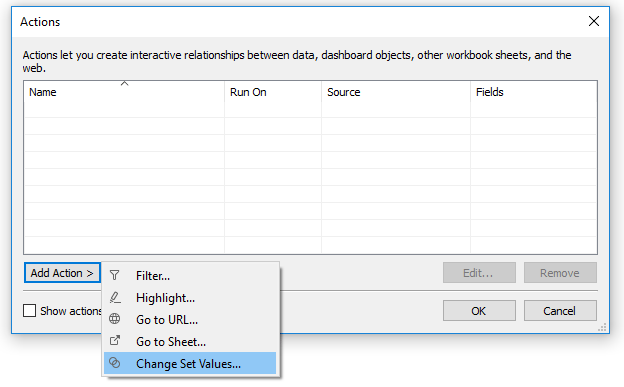
Now build your dashboard with the views you want to connect. And then add a new dashboard action, choosing "Change Set Values."
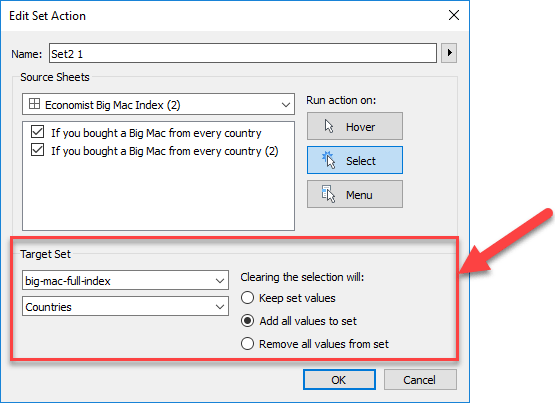
The “Edit Set Action” dialog gives you options to choose a data set and which set to update. The “Target Set” section (highlighted below) has two dropdowns. The top one is the list of data sets. The lower is the list of sets. At the time of writing (July), these dropdowns are not labelled, but once I worked it out, those were the only things I needed to edit in order to create the proportional brushing.
That's all it takes to do proportional brushing!
I suspect there are a vast amount of other interesting things people will do with set actions in Tableau, and I can't wait to see what everyone does. At Tableau, we love to get your feedback on new features, and I especially like seeing what ideas people blog about.
Additional resources
- Please, do get involved in our beta programs and help us shape our latest features.
- Download my workbook from here (I can't upload it to Tableau Public yet, as that's not been updated to the latest beta). You will need Tableau 2018.3 for this to work.
- I'd also like to thank Alex and Marie at The Economist Data team for their help in using the data. We featured them on a recent Tableau live stream that you should check out!
- The Big Mac Index data was also the source for the European Iron Viz competition at Tableau Conference, Europe. Watch great Iron Viz recap.
Historias relacionadas

How Team USA uses data to build a digital HQ
 8 Febrero, 2022

Tendencias de datos influyentes en 2022
 3 Febrero, 2022

Healthcare Analytics Hub Starter Kit: Get the data you need faster
 18 Octubre, 2019
The purpose of the Healthcare Analytics Hub Starter Kit is to provide a sample of what your healthcare app could look like. It’s not a complete solution; instead, it’s focused on what’s possible. Please contact your Tableau Account Manager to get started today!
Suscribirse a nuestro blog
Obtén las últimas actualizaciones de Tableau en tu bandeja de entrada.