Learn, share, repeat with the Tableau community


For my Fanalytics talk at TC16, I chose not to talk about a specific visualization. Instead, I explained how Tableau has been a turning point in my day-to-day work.
Tableau has made it possible to move from a situation in which I couldn't analyse or visualize most of the open data available. Nowadays, I spend a significant part of my spare time visualizing data with Tableau.
Learn more every day
Tableau Public is one of the best ways to enhance my skills. And I don’t mean just my Tableau skills, which sounds obvious, but also my data-analysis and data-visualization skills.
Tableau Public has helped me think in a more analytical way. It’s improved my communications skills and taught me to focus on the key messages I want to convey. I’ve also discovered new data sources to explore and learned to analyse data from different perspectives. In short, Tableau Public pushes me to learn more every day.
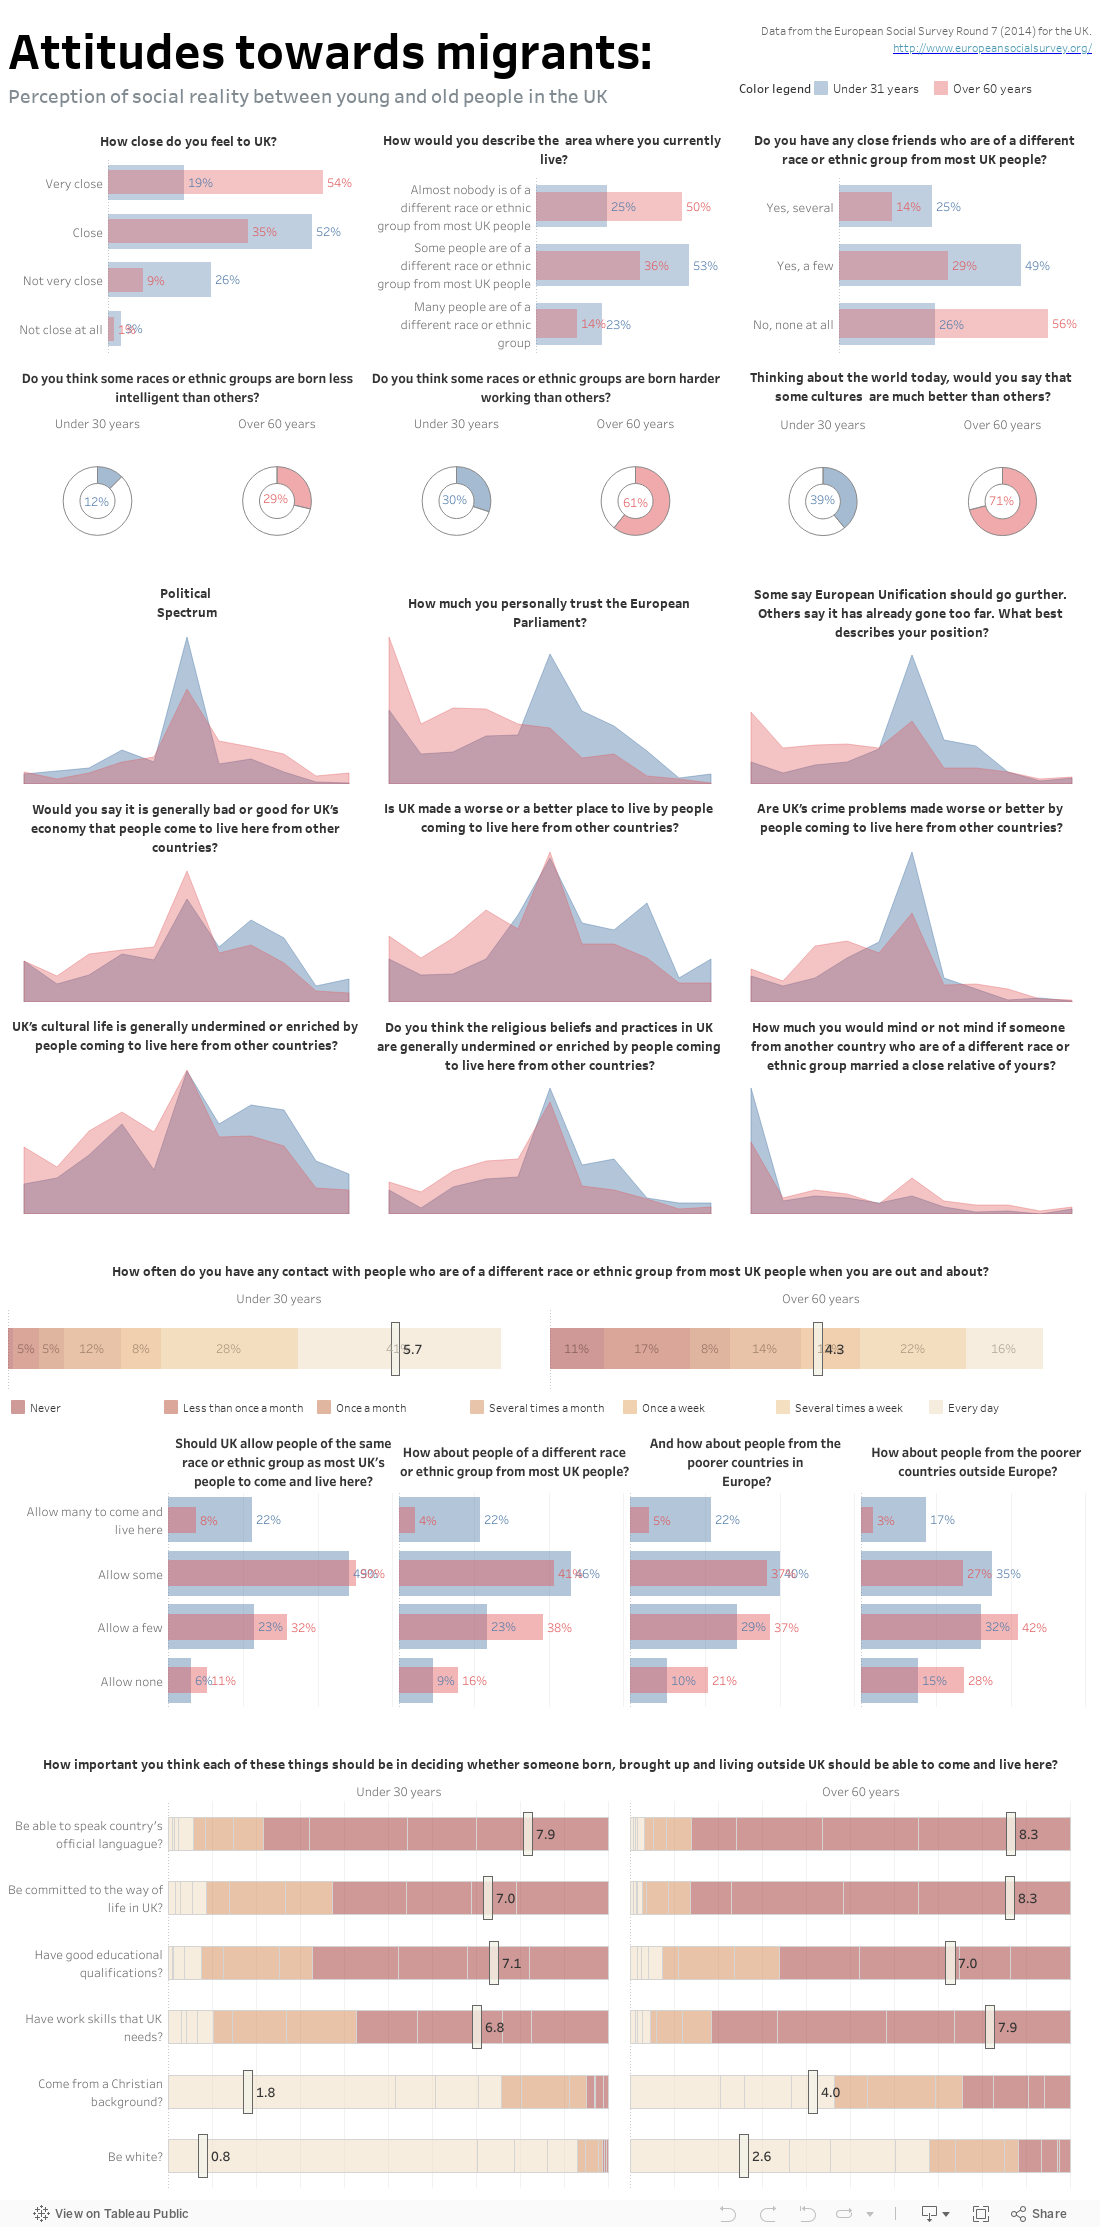
But how do I learn, exactly? The first way is by reverse-engineering dashboards from other Tableau Public users. It’s as easy as downloading a workbook you like and figuring out how the author built it.
There are many reasons to download a workbook: a calculation that you’d like to learn, a chart you really like, a particular design that you want to use in the future. For the same reasons, allow other users to download your workbooks. This is, in my opinion, one of the key points of all of Tableau Public.
The second way is through the great Tableau community. Read blogs, ask questions on Twitter, and save dashboards for future reference. The amount of knowledge, inspiration, and ideas you can get from the community is huge. And it's probably one of the key reasons why Tableau is the great tool that it is.
But of course, miracles don’t exist. Willpower and effort are necessary as for anything. The more you practice and more visualizations you create, the better. Practice is the only real way to improve doing something. Think about your hobbies, the things you are interested in, and look for data sources about them.
Or join the community for Makeover Monday, a great way to practice every week without spending time searching for data sets.
Don’t forget to also learn to use additional tools that can save you a lot of time getting the data from websites where the data is not available to download in a nice way. Import.io or ParseHub are two good free options. Alteryx, an excellent software for data preparation and data cleansing, is also a perfect pairing for Tableau.
Share your knowledge
The second main reason why Tableau has make such a big difference for me is that I can also share my knowledge. As Tableau Zen Master Andy Kriebel told me when I first joined The Information Lab, the best way to learn something is to teach it. And I find it very satisfying to help others learning Tableau. I often discover people who are interested in the same topics as me, and they can learn something about the world in which we live by using my visualizations.
For me, giving back to the community is also a priority. So I started my own blog in Spanish, makeadifferencewithdata.com, when I saw that there were no Tableau or Alteryx blogs written in Spanish. I'm not so concerned about whether someone else has already explained how to do something, especially since we all have a different way of explaining things. Plus teaching and writing about something is one of the best ways to internalize it. The more you share your knowledge and teach others, the better you will use Tableau and more confidence you’ll gain.
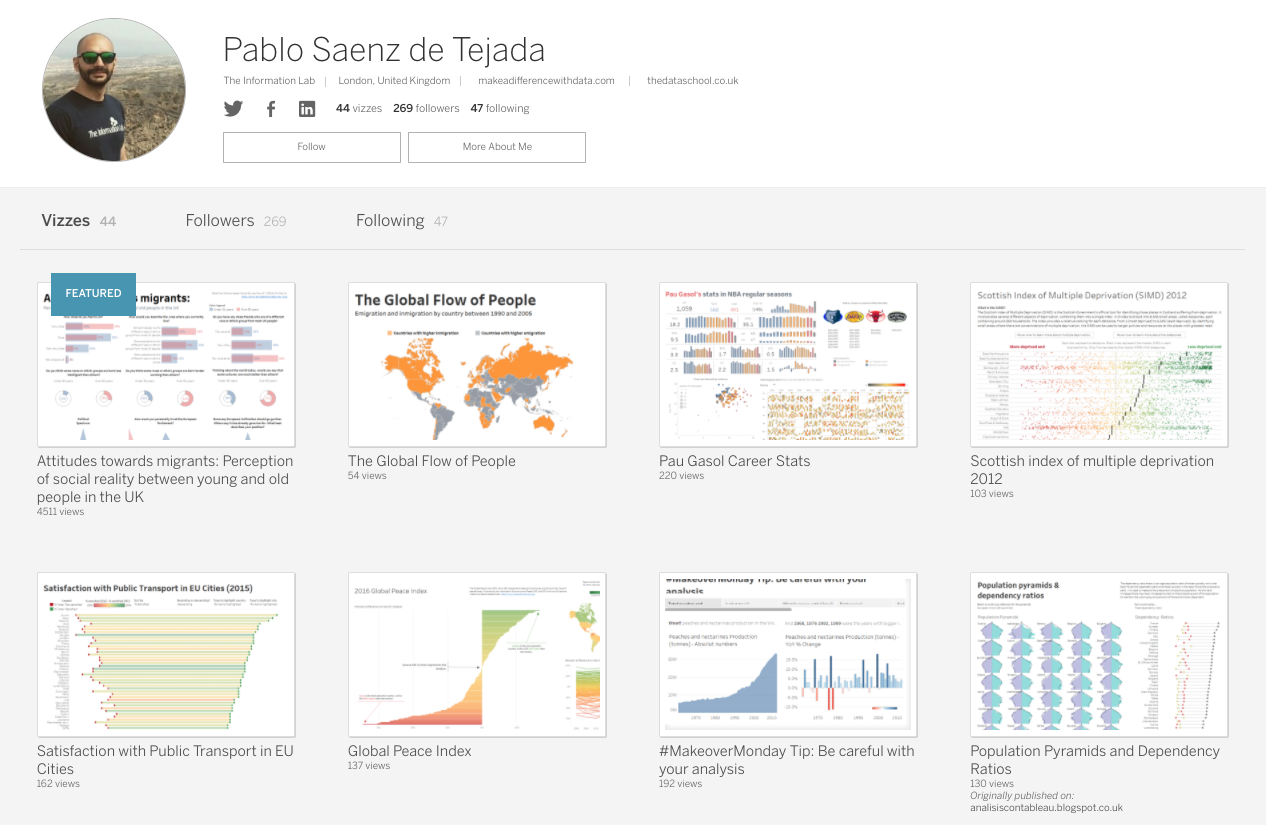
Learn, share, repeat
These two reasons act also as an iterative process; the more you improve your skills, the more you want to share your knowledge. And improving how you share it will make you also continue improving your skills to have new things you can do, teach, and share.
Last but not least, remember that a visualization is, in the end, a way to share data in a meaningful way. When we share data, we are sharing information. And when we share information, we are sharing knowledge. A visualization that is not used loses all its power. It's the authors responsibility to make it as meaningful as possible but it's also our responsibility as users to try to get at least one insight from each visualization we find interesting.
Learn at least one thing from each visualization. Probably that's a third reason why Tableau has been a turning point in my day to day: It allows me to learn something new every day.
For more tips, ideas, and vizzes by Pablo, check out his Tableau Public profile page. You can also connect with him on Twitter @pablosdt.
Historias relacionadas

Meet Iron Viz 2024 Finalist Jessica Moon
 15 Abril, 2024

DataFam Roundup: April 8–12, 2024
 12 Abril, 2024

Meet Iron Viz 2024 Finalist Pata Gogová
8 Abril, 2024
Suscribirse a nuestro blog
Obtén las últimas actualizaciones de Tableau en tu bandeja de entrada.