The Tableau Interactive Sports "Viz" Contest
Do you love sports and sports data? Do you spend hours poring over stats trying to figure out who is going to win the championship? Tableau has a new contest that is perfect for you!


Do you love sports and sports data? Do you spend hours poring over stats trying to figure out who is going to win the championship? Tableau has a new contest that is perfect for you!
Continuing on last year's Tableau Public visualization contest, there will be three viz contests this year, all focusing on a particular type of data. This Sports Data contest is our second this year, following the Business Visualization Contest won by Alex Kerin in June.
Anyone who can download Tableau Public and visualize sports data can enter. Even if you don't have data right now, you might want to look for some because the winner is going to be taking away a free roundtrip ticket to attend the 2011 Tableau Customer Conference. This includes 3 night’s accommodations at the Encore and a chance to compete in the Iron Viz championship with the winners of the other two contests. The winner of Iron Viz will take away a new iPad2, and $2,000.
Intrigued? Learn more here. If you need some data, we highly suggest browsing through a couple of these sites:
- Baseball Statistics from Fangraphs.com
- Olympic Sports stats from Sports-reference.com
- Football stats from CBS Sports
- Soccer stats from SoccerStats.com
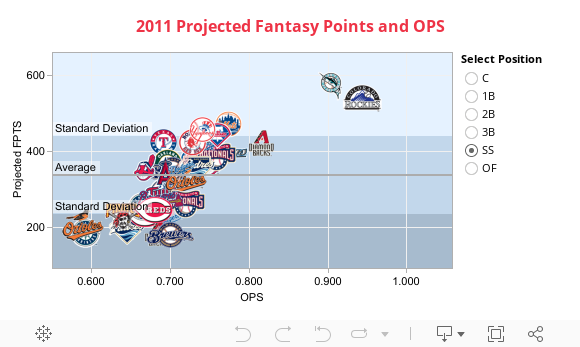
Still need some inspiration? Check out Al Melchior's pre-season baseball viz, which shows the projected fantasy points and OPS of each team in the MLB. The higher to the right the team is, the better they are expected to do.
Suscribirse a nuestro blog
Obtén las últimas actualizaciones de Tableau en tu bandeja de entrada.