DataFam Roundup: Feb 19, 2021


Welcome back! Dig into the latest DataFam Roundup—a weekly blog post that brings together what’s trending in the community all in one post. As always, we invite you to send us your content—and the DataFam content from your peers that have inspired you! Find the content submission form here.
Celebrating Black History Month
- Racial Equity Data Hub: Data is core to understanding race and equity in American life. The Racial Equity Data Hub is a platform to provide the data and tools needed to understand and take action against racism in all of its forms. Read more here.
- An interview with Equity Task Force member, Candra McRae: Get to know Equity Task Force member Candra McRae through her conversation with fellow Task Force member Allen Hillery as they discuss the power of simple data viz, embracing data, and the road to inclusive and equitable communities.
- Thurgood Marshall Donation Drive: This DataFam Donation Drive helps provide direct funds to the Thurgood Marshall College Fund. Tableau will match donation funds during the month of February up to a total of $10,000!
- Honoring Black History Month with Tableau community activities: The Tableau Community team, with the help of the DataFam, has put together some ways we’re celebrating Black History Month. Join us!
DataFam content
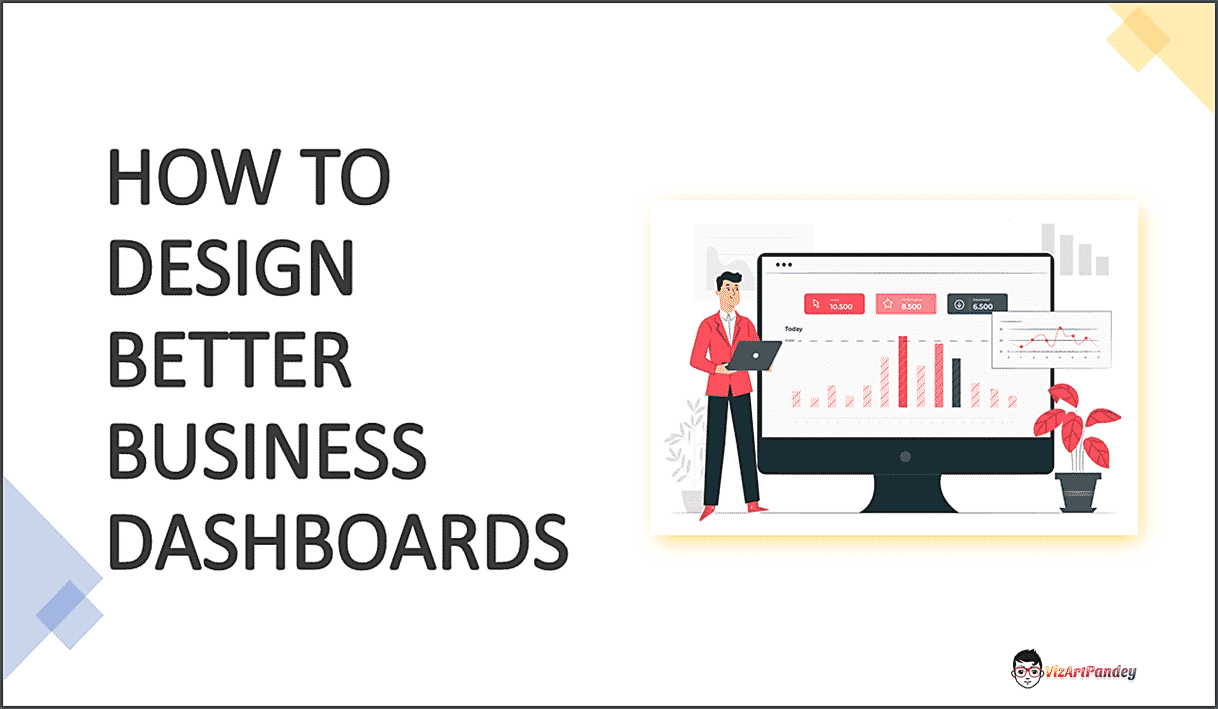
How to Design Better Dashboards, Pawan Sachdeva
Dive into content created by the Tableau Community:
- Blog How to Design Better Dashboards Pawan Sachdeva
- Video Demystifying the Tableau Server REST API (using Python) Devyx
- Blog January 2021 - Viz Favorites Josh Tapley
- Podcast Data ATA - Jacqui + Brian Moore Zach Bowders
- Blog Four Quadrant in Tableau Jeffrey A. Shaffer
- Blog A Beginner’s Guide to IF Statements in Tableau Ken Flerlage
- Curated List Lastest jobs working with Tableau Alan Murray
- Event Recording Server Admin Tableau User Group
Upcoming events
Join an upcoming Tableau User Group event:
- February 22, 2021: Tableau Prep User Group Meets Data + Women
- February 23, 2021: Data Centralization: Driving Analytics Through Integration
- February 24, 2021: Sports + Entertainment Tableau User Group
Check out all the virtual Tableau User Group events here.
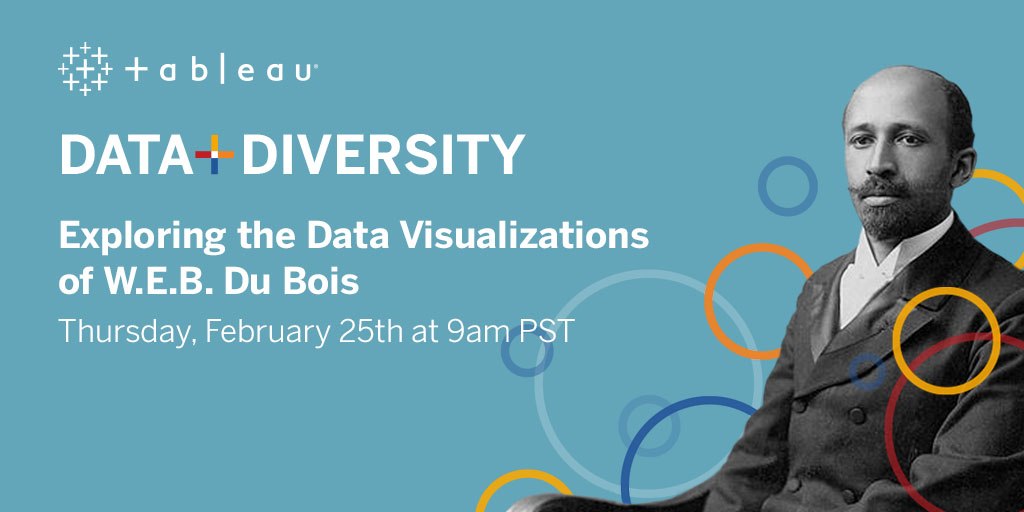
Feb 25, 2021 Data + Diversity Event: Join the virtual event celebrating the life and visualizations of Black American civil rights activist and writer, W.E.B. Du Bois.
Feb 25, 2021 Chart Chat, Round 19: Watch as Jeffrey Shaffer, Steve Wexler, Amanda Makulec, and Andy Cotgreave, debate the good, the bad, and the “screaming cats” of data visualization.
Vizzes
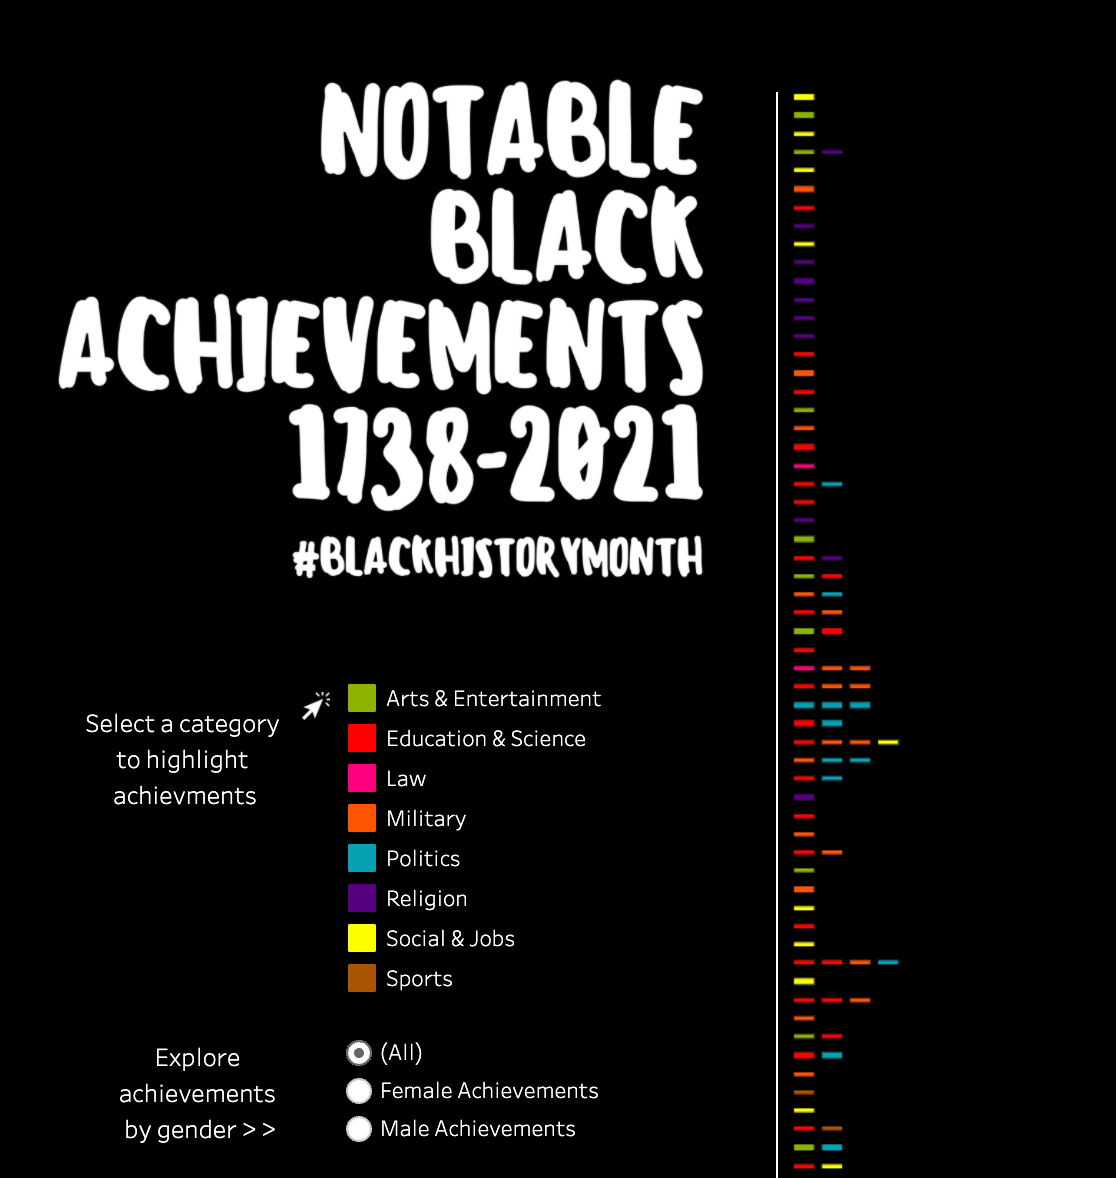
Notable Black Achievements 1738-2021 Visualization by @Aida_Hor
Catch this week’s Viz of the Days here and subscribe to get them emailed directly to your inbox.
Check out some inspirational vizzes created by the community:
- Notable Black Achievements 1738-2021 @Aida_Hor
- Color Blind Simulation David C. Velleca
- Data is Plural | The Dashboard Edition Mark Connolly
- Tableau Ambassadors - Find & Connect Alan Murray
Community Projects

Stay in the loop on the Tableau Community Projects:
Makeover Monday: Join the community every Monday to work with a given data set and create better, more effective visualizations. #MakeoverMonday
Workout Wednesday: Build your skills with a weekly challenge to re-create an interactive data visualization. #WOW2021
Sports Viz Sunday: Create and share data visualizations using rich, sports-themed data sets in a monthly challenge. #SportsVizSunday
- February 2021: NFL Salary Cap
Iron Quest: Practice data sourcing, preparation, and visualization skills in a themed monthly challenge. #IronQuest #IronQuest
- February 2021: History
Storytelling with Data: Practice data visualization and storytelling skills by participating in monthly challenges and exercises. #SWDChallenge
- February 2021: Draw your data
Project Health Viz: Uncover new stories by visualizing healthcare data sets provided each month. #ProjectHealthViz
- February 2021: UK Hospital Admissions for Youth <18 (2016-2018)
SDG Viz Project: Visualize data about Sustainable Development Goals provided by the World Health Organization. #TheSDGVizProject
- February 2021: Goal 13 - Climate Action
Preppin’ Data: A weekly challenge to help you learn to prepare data and use Tableau Prep. #PreppinData
- 2021 Week 7: Vegan Shopping List
Real World Fake Data: Create business dashboards using provided data sets for various industries and departments.#RWFD
- Dataset #6: Social Media/Marketing
Viz 2 Educate: Each month, create vizzes on global education syllabus topics as resources for teachers worldwide. #Viz2educate
- Topic #2: Zoology
Viz for Social Good: Volunteer to design data visualizations that help nonprofits harness the power of data for social change. #VizforSocialGood
Diversity in Data: An initiative centered around diversity, equity & awareness by visualizing provided datasets each month. #DiversityinData
- February 2021: Black History Month
Historias relacionadas

DataFam Roundup: April 8–12, 2024
 12 Abril, 2024
DataFam Roundup: April 1–5, 2024
5 Abril, 2024
DataFam Roundup: March 25–29, 2024
29 Marzo, 2024
Suscribirse a nuestro blog
Obtenga las últimas actualizaciones de Tableau en su bandeja de entrada.