Animating the Solar System: How to Make Images 'Rotate'


This guest post by Merlijn Buit and was first featured on Infotopics. Check out the site for more amazing #VizHacking

The solar system is fascinating, and there is a lot of data about it on the Internet. So, as you can imagine visualizing and animating the solar system in Tableau immediately caught my attention. I have attempted to generate an animated solar system with a limited data set in Tableau.
1. Looking for Data
First, I started searching the Internet for information about our solar system and quickly landed on NASA's home page. I also came across http://www.nentjes.info/Data-en/data.htm, a very small data set about the solar system that was perfect for this project. This dataset caught my attention because it was so simple. I hoped that with this smaller dataset I could show how the different planets orbit around the sun in Tableau.
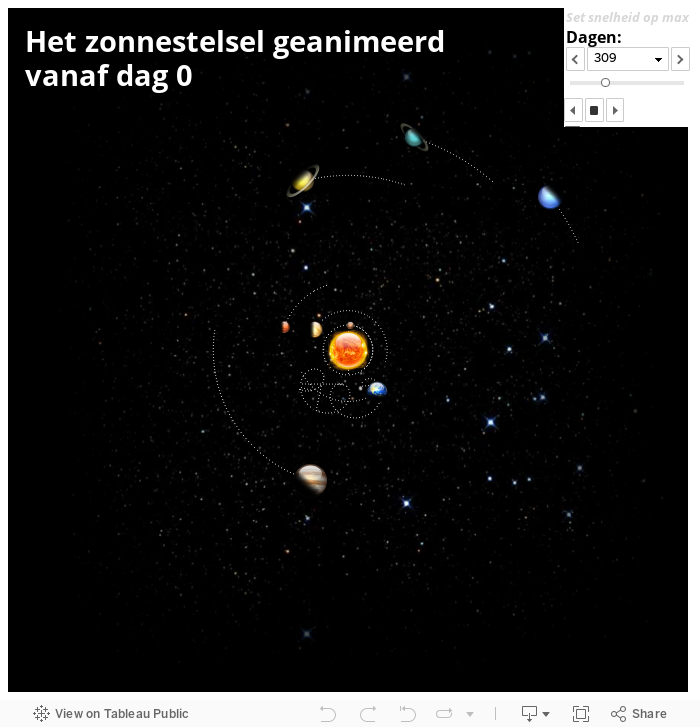
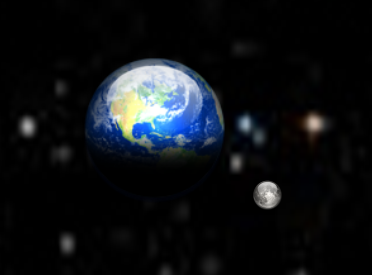
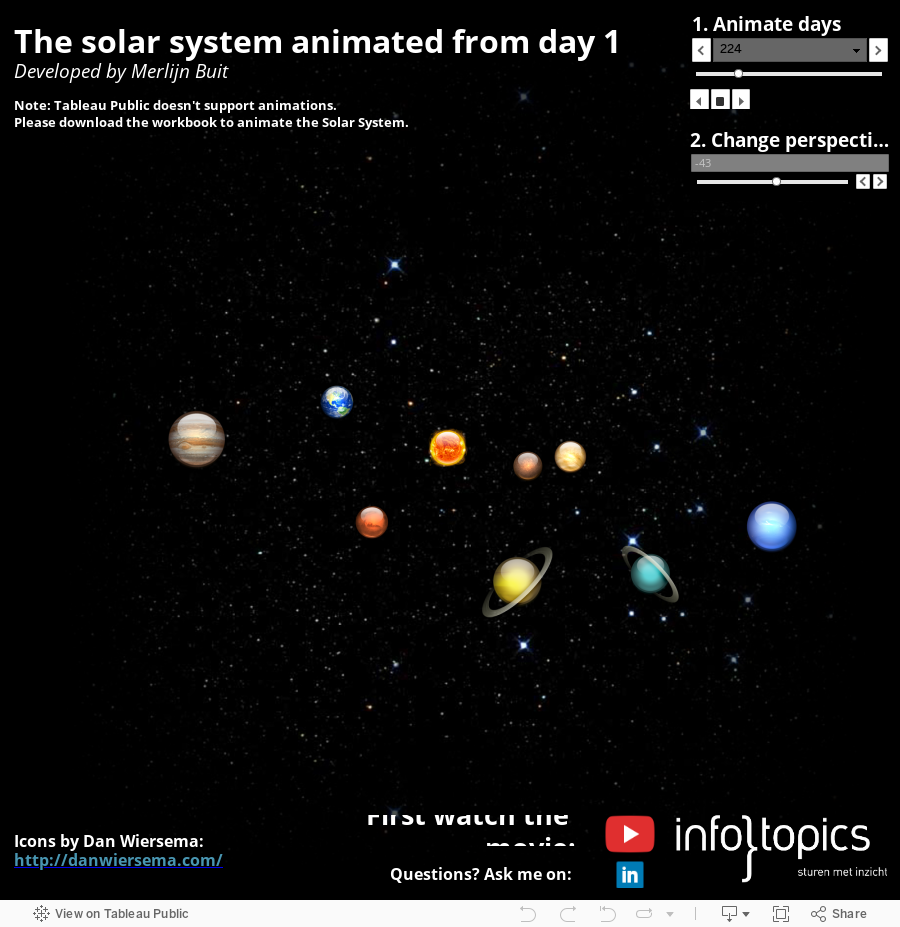
This is the result! Follow below to see how I made it.
Please note: I'm not an astronomer. My model is not suitable for the analysis of our galaxy. I chose a logarithmic scale so that the planets would not hover over each other during their orbits. In addition, I sped up the orbital rate of the largest planets, as this would give a clearer animation. Finally, I have 1,000 days animated whose first day at X = 0 and Y = 0 starts.
First I prepared the data in Excel, this was easier and took little time.
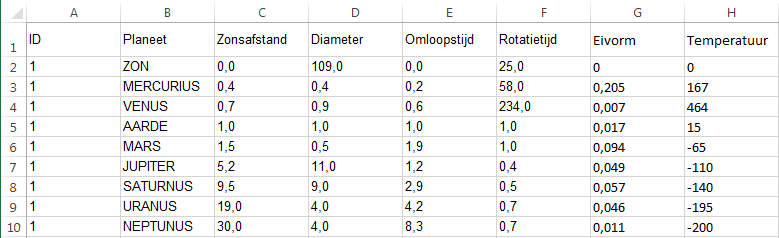
At NASA I also found the planets shape and temperature values. These values I have used in my model.
2. Sine, Cosine, and Log Scales
The first question I asked was how I could calculate the X and Y coordinates of the planets in relation to time. I found a formula for this online and, thankfully, it wasn't too complicated.
X = cos (degree) * radius
Y = sin (degrees) * radius
In Tableau terms, it means the following:
X = COS (RADIANS (([days] * 0.98630136) / [Orbital period])) * [Log Sun distance + 1]
Y = SIN (RADIANS (([days] * 0.98630136) / [Orbital period])) * [Log Sun distance + 1]
This seems more complicated than it really is. Let me divide the formula and tell each part what it means:
X = COS (RADIANS (([days] * 0.98630136) / [Orbital period])) * [Log Sun distance + 1]
The COS function in Tableau works with radians. So I need to convert degree angle to a radial. Tableau has the RADIANS function here. Since we do not work with degrees but with days I calculated how many degrees one day. This is 360/365 degrees per day. I manually put in the formula, because I think it is unnecessary for this Tableau itself always should calculate.
The orbit of the earth is 1. However, the other planets have an orbital period shorter or longer. That's why I have the days times the amount of degrees divided by the orbital period.
I have used a logarithmic scale, as a normal scale would have Venus, Earth and Mars would running over each other because Neptune has a distance of 30 to the sun. The logarithmic scale has changed its proportions to a scale of -2 to +2. This makes the planets revolve neatly together. I created an extra field in which I calculated To calculate the log of the distance to the sun. This is the following formula:
[Log Sun distance +1] = log (Sun distance + 1)
+1 I've done here, because log (1) = 0. As a result, certain planets would not be visible, since multiplying by 0 is not possible.
3. Background
For the solar system, I took a fixed X and Y axis from -2 to +2. I downloaded a starry sky and set it as wallpaper.
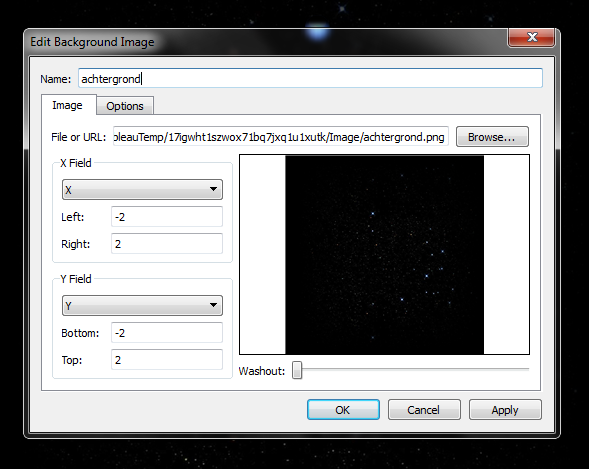
Map -> Background Images -> New image
4. Shapes
In addition, I downloaded pictures of all the planets and saved these to my "Shapes" folder in my Tableau Repository (User \ Documents \ My Tableau Repository \ Shapes \).
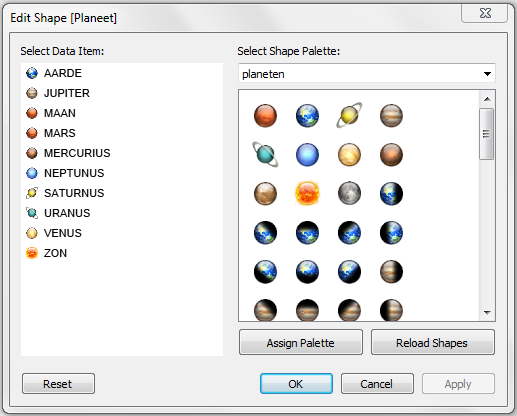
Here are my planet shapes - note that I have multiple shapes for each planet with different shading on each
5. Having all your Planets all in a Line
I wondered if there was a day when all the planets would line up in one row. After some searching on the internet I found the following blog http://wibnet.nl/heelal/zonnestelsel/zonnestelsel-hoe-vaak-staan-alle-planeten-op-een-rij.This blog says that in the year 2854 all the planets will be (pretty much) line up in a row.
If I want to know the current position of the planets I must count back to the year 2014: the 2854th - 2014 = 306 600 days until all the planets around again will line up. This means to calculate back to the this state is about -306 600 days. I checked this out and it works perfectly. However, I chose to start on day 1 (not day 306 600) - so that the difference in turnaround time is more visible.
6. Houston We Have A Problem
In animating the planets I had to play a trick. At first, I tried to animate the planets with a parameter. While this works fine, you cannot use a parameter in the pages function. And it's the pages function that allows you to create animations in Tableau.
To fix this I created an additional tab in my excel dataset with the numbers 1 -> 1000. All of these numbers I gave an ID to first. Additionally, in the dataset with planets I also gave the planets an ID. This meant I could blend my datasets in Tableau's data-prep pane.
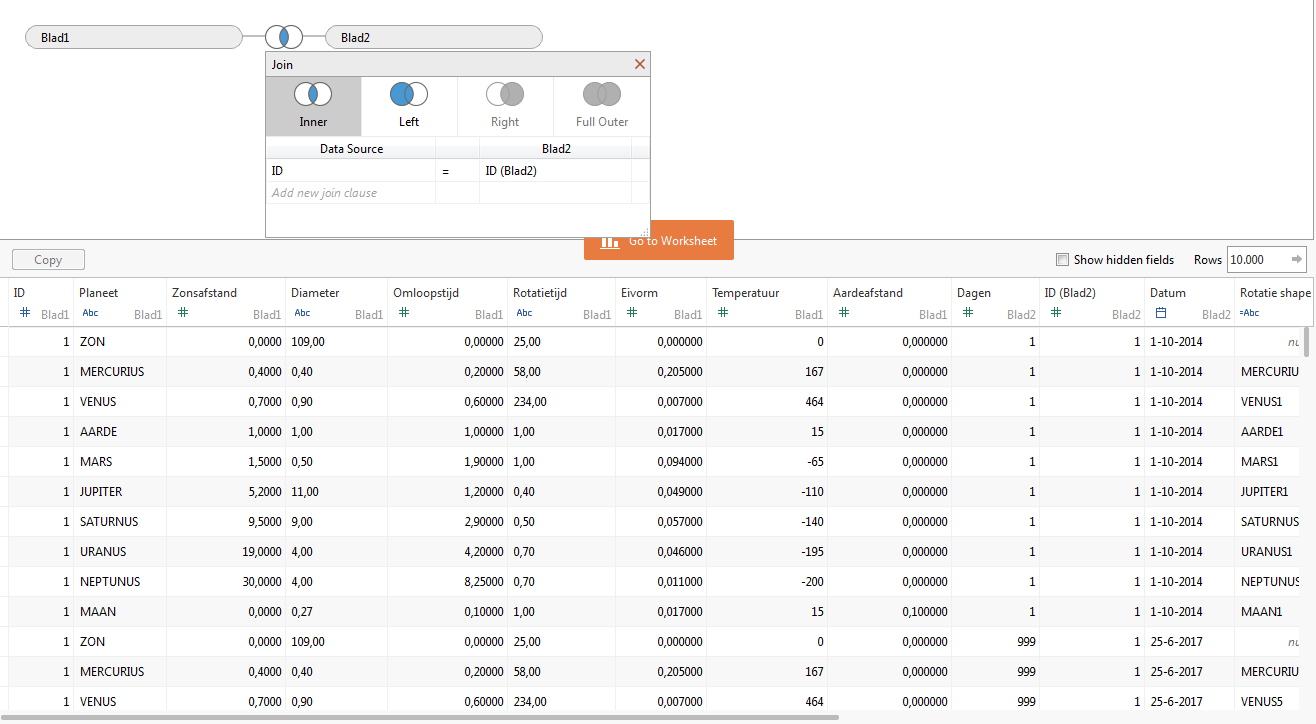
Inner join to the rescue
Since I now had an ID field in common I could blend my two datasets using an inner join. This left me with one line of data per day per planet. This is not the best solution, but I could not find a better solution to animate the planets orbiting each other.
7. Moon around the Earth
Some of you will have noticed that in the YouTube video is also a moon hovers around the Earth. This is an optional addition that allows for an adjustment in the X and Y calculations.
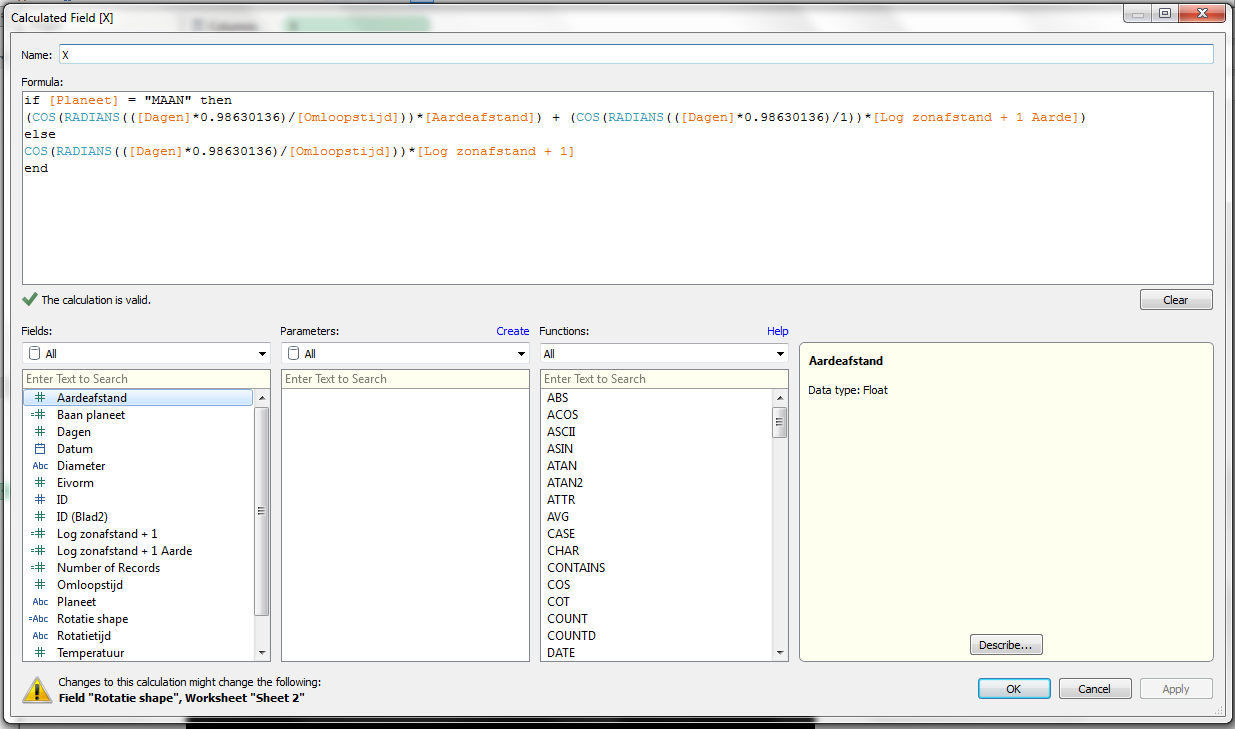
This is the COS part of the equation for the moon
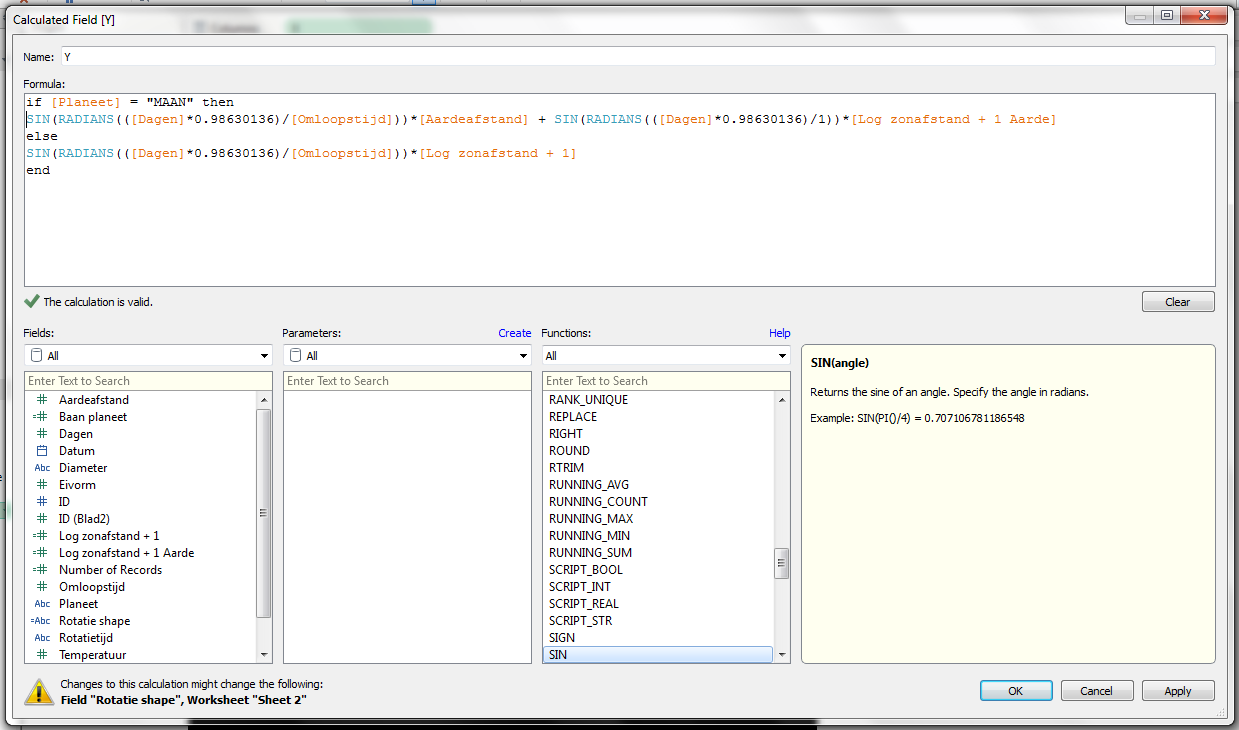
This is the SIN part of the equation for the moon
In the above formulas, it checks to see if a planet is 'the moon'. If the planet is 'the moon' it then calculates the distance from the Sun to the Earth + the distance from the Earth to the moon. Example:
Earth X = 1
X moon = -0.2
X result = 0.8
[Log Sun distance +1 Earth] is a calculated field which contains the log from the earth. I made this variable so I only had to change to change it in one place. This is the result:
8. Getting the Planets to Rotate!
Finally, it I really wanted the planets to look like they were rotating as they orbited the sun. I thought I could get this effect by using planet images that had the shadow if cast by the sun on them. I used Photoshop to create shadows on different planets. I chose to make 8 different positions for the planets with using shadows. This is why I had multiple images for each planet in my custom images.
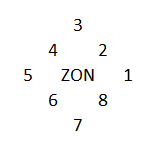
How each planet would be positioned at some time to the sun
In total I made 64 shadows in Photoshop. As there is no 'rotate' function in Tableau I had to create a calculate field to simulate this. Calculating the correct image with the shade is slightly more complex (optionally, it is possible to use a pie chart and to place them back with a dual axis on the planet).
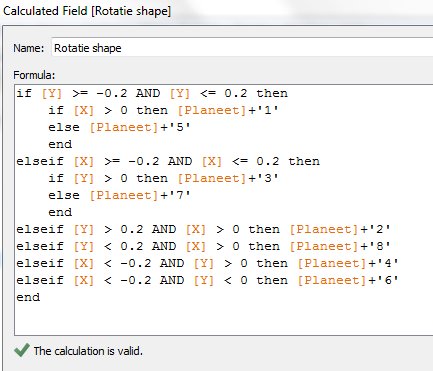
My 'Rotation' calcualtion
The above IF statement will look at the current location of the planet. At this location the right image is generated.
Check out the rotation yourself in this viz (use the sliders to change the number of days into a cycle and the "3D" perspective you're taking on the planets).
10. Where to Next?
I think there is still a lot I could add to this viz - I want to calculate the temperature for each planet dependant on its distance from the sun at any given point in time. If you have any questions or ideas please send me an email: merlijn.buit@infotopics.nl
Historias relacionadas

Meet Iron Viz 2024 Finalist Jessica Moon
 15 Abril, 2024

Meet Iron Viz 2024 Finalist Pata Gogová
8 Abril, 2024

Student to BI Analyst, How Tableau Can Lead to a Successful Data Career
 20 Marzo, 2024
Suscribirse a nuestro blog
Obtenga las últimas actualizaciones de Tableau en su bandeja de entrada.