New in 9.0: Data Interpreter and Cleanup Tools


With the release of Tableau Desktop Public Edition 9.0, there's a ton of goodies for journalists, bloggers, and viz fans to be excited for. For me, the most exciting features are the ones that make data cleanup easier.
We've all been there. You get all excited about a great new dataset but when you open it up in Excel there's merged cells, blank rows and columns, cross-tabbed data and all of those other spreadsheet things that make us cry. It's never fun to come to realization that you'll have to spend the next couple hours of your life reformatting a dataset so that you can get it into Tableau and let the data party begin. Luckily, version 9.0 comes with a few handy new features that should save you lots of time and headaches!
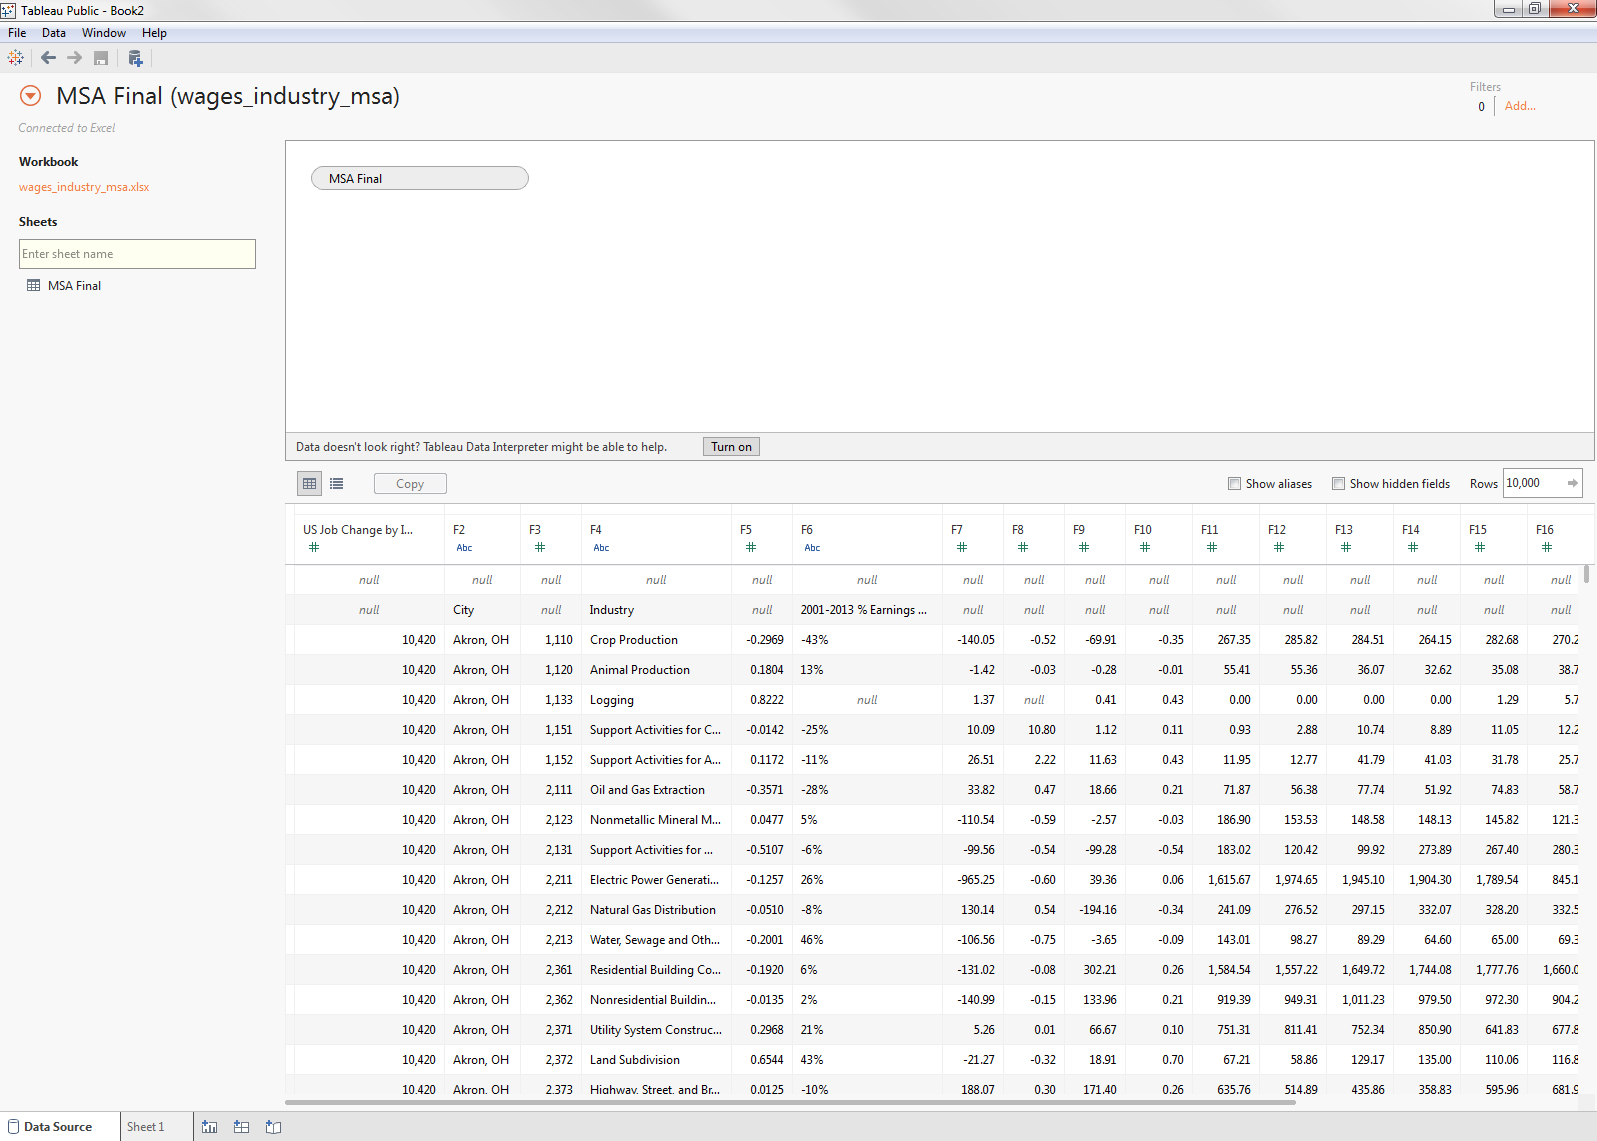
Yuck! That data is NOT BEAUTIFUL.
Data Interpreter
One of the easiest new features to use is the Data Interpreter. This tool cleans up merged cells, titles, footnotes, blank rows, and all kinds of other annoying stuff. Just click the button to turn the data interpreter on and that messy dataset above starts to look pretty nice:
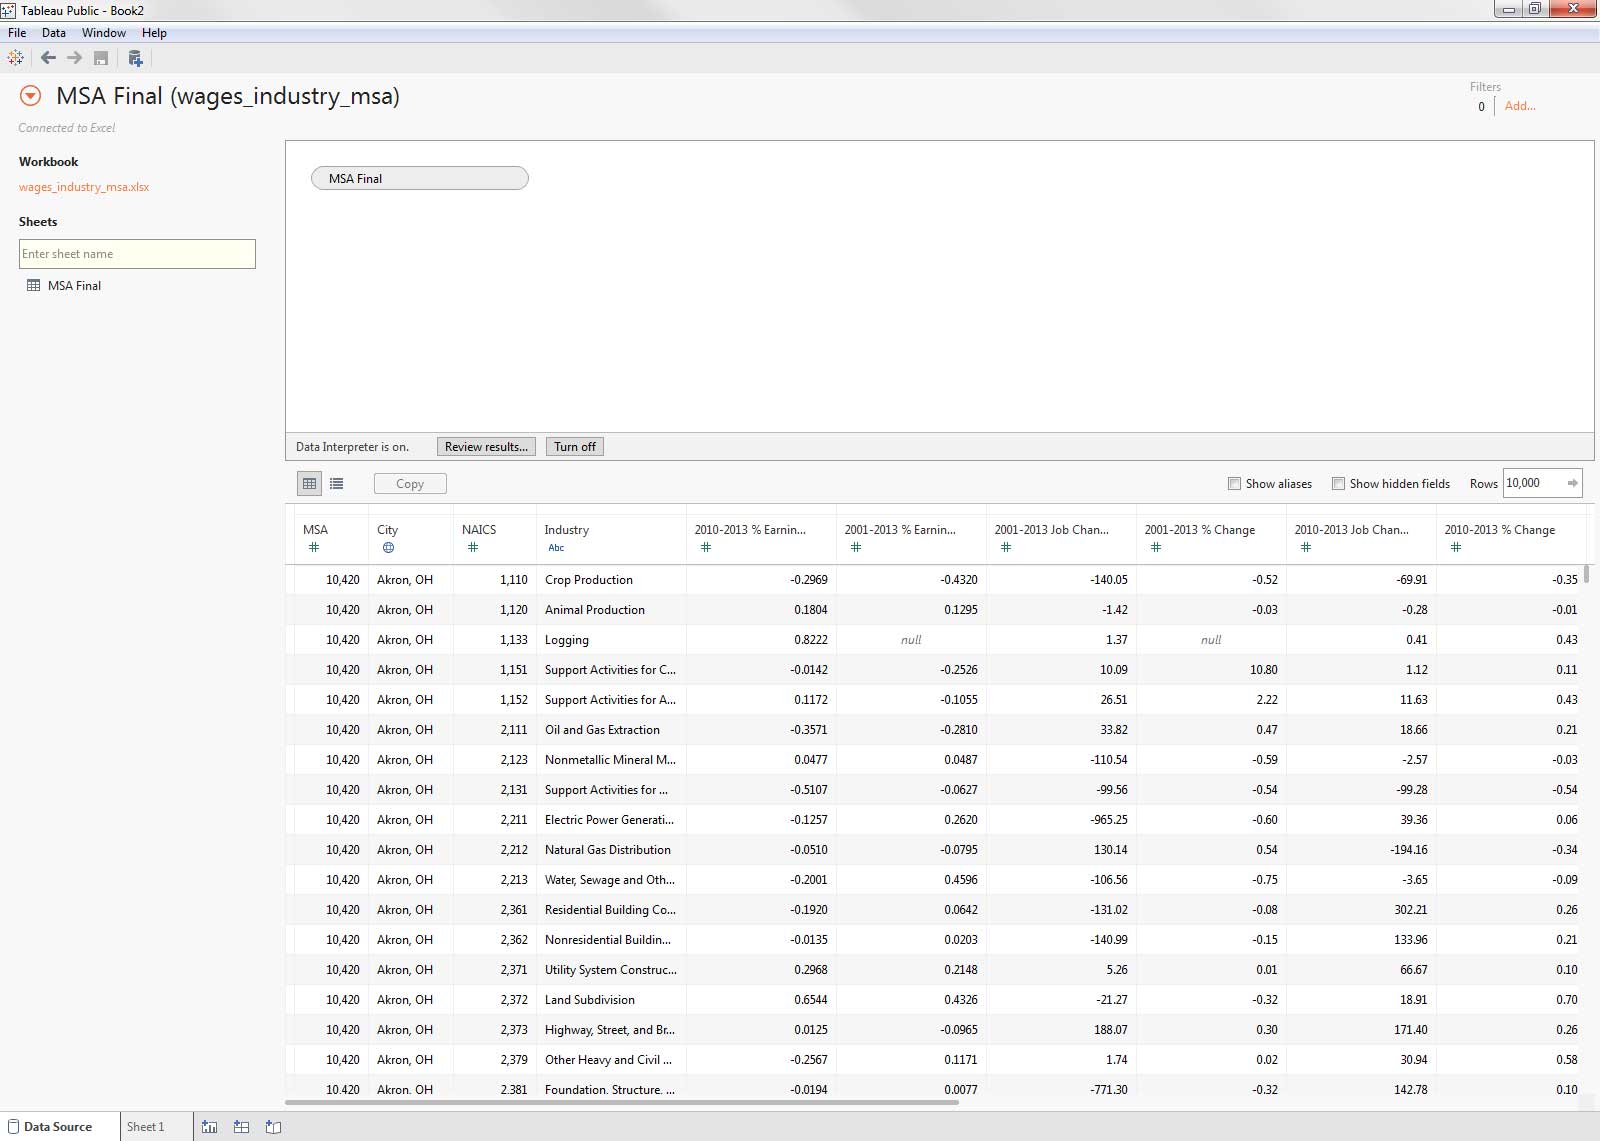
Voila! It's so clean!
Pivot
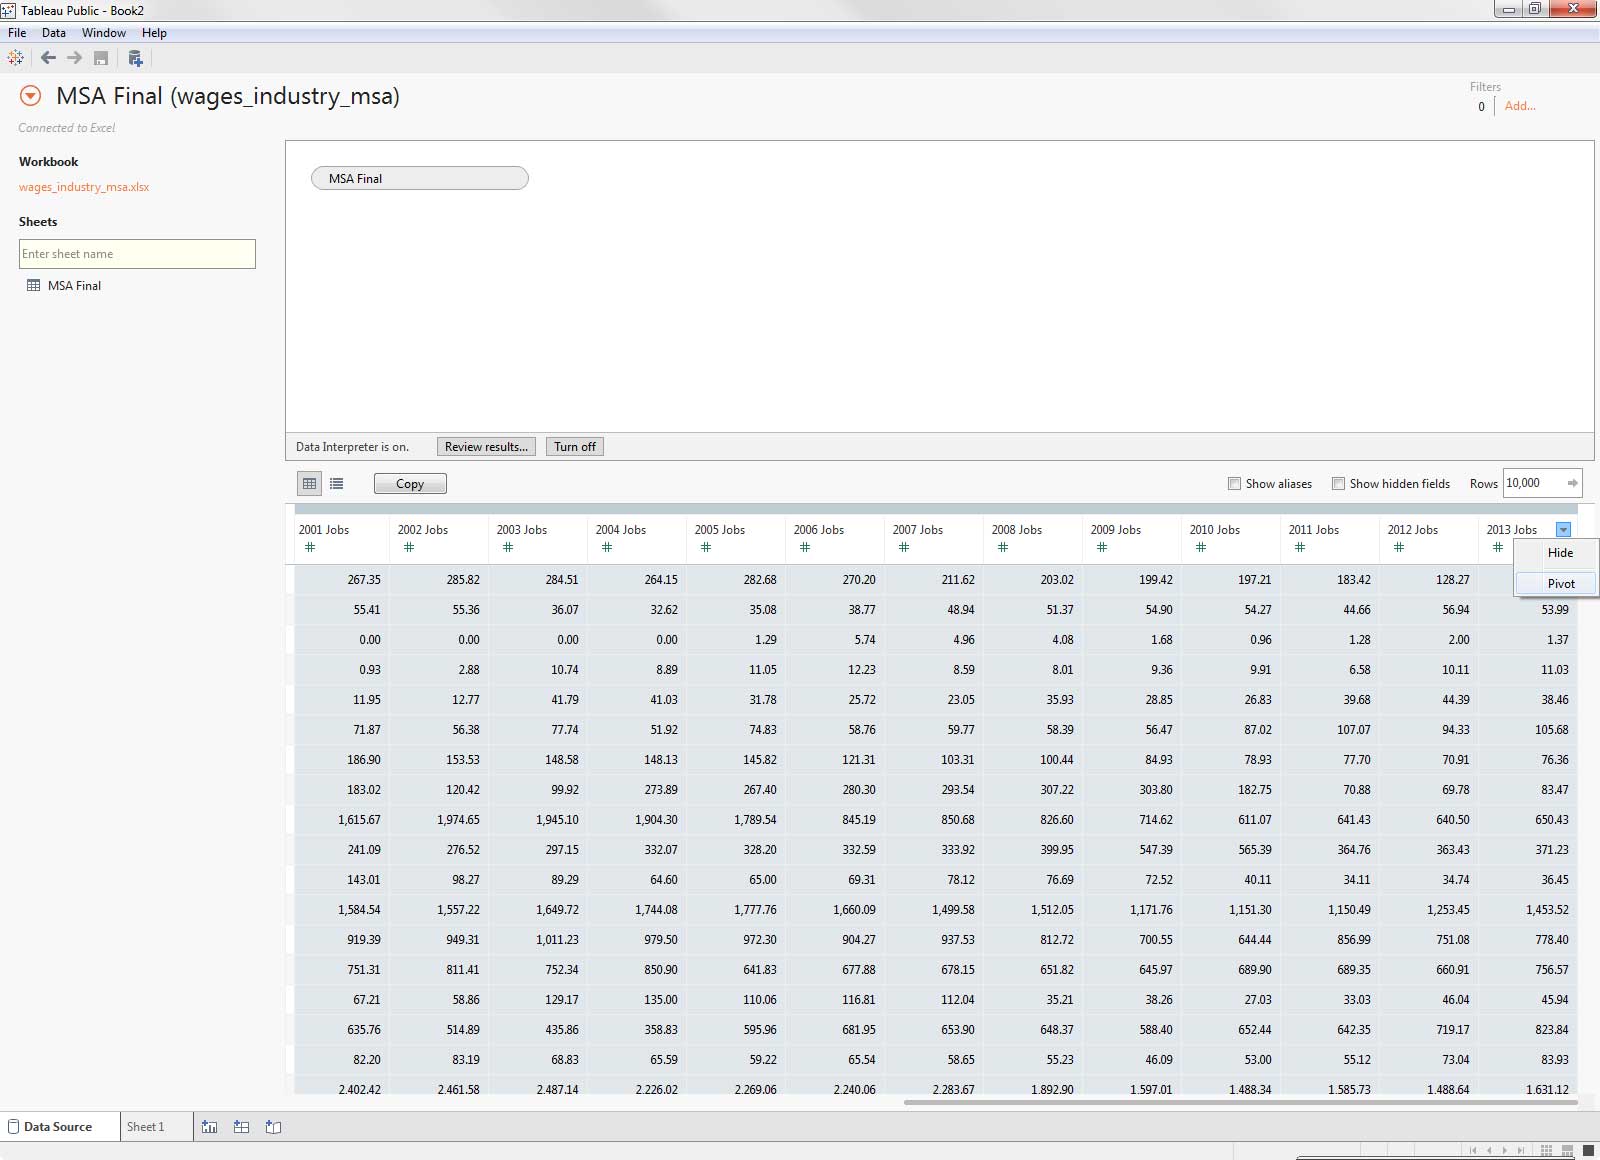
Crosstabs: The bane of my existance.
If you've been a Tableau fan for a while, you probably already knew about the Tableau Reshaper Tool. Now that functionality is built right into the data connection experience! In the dataset above, you can see that I have a different column for every year. If I want to make a line chart with year as my columns, I'll need those columns to combine into one. All you have to do is hold down control or command to select all the columns you want to reshape, click the drop down and select "Pivot". If there are many adjacent columns that you want to pivot, select the first one, and then while holding shift, click the last one.
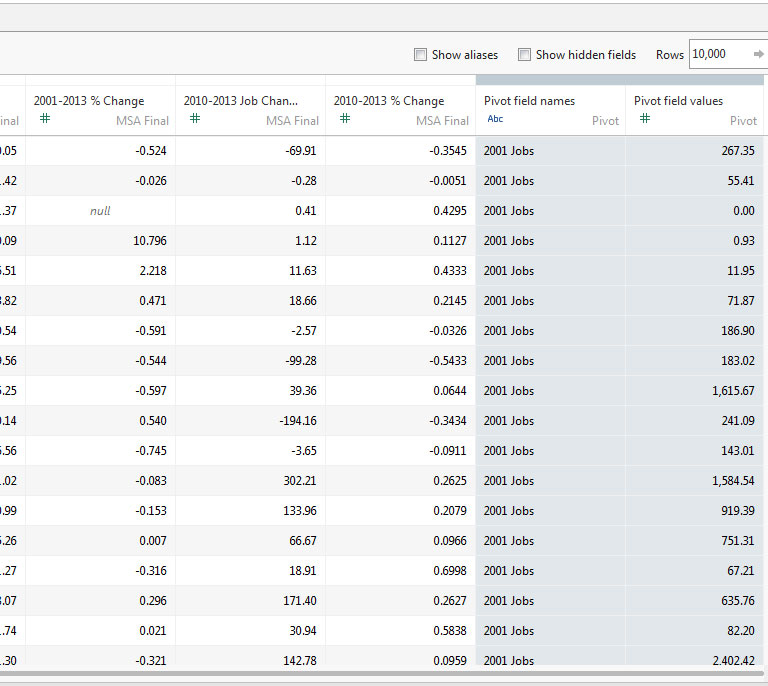
One measure and one dimension! Makes so much more sense!
Split
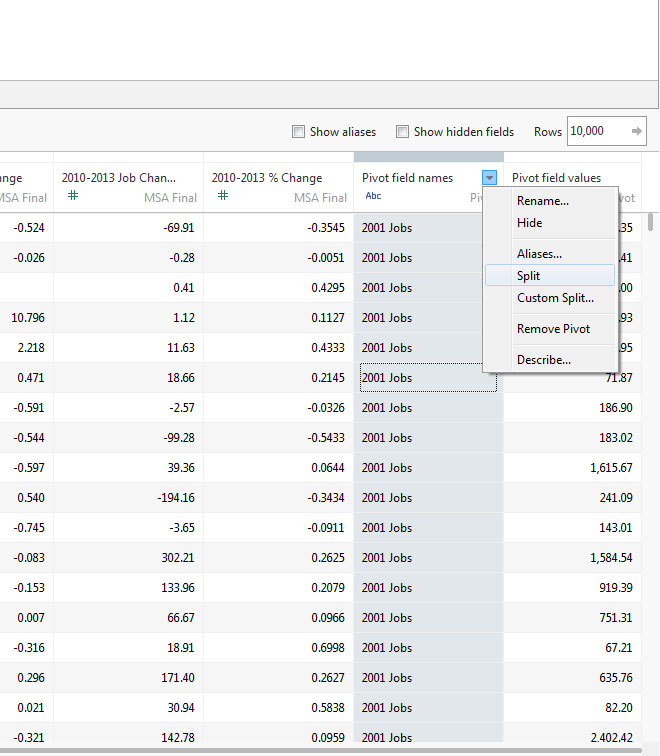
An inevitable part of most data cleanup tasks for me has always been using the "Text to Columns" feature in Excel to separate out different pieces of data that are contained in a single cell. But I've avoided Excel this whole data cleanup example and I intend to keep it that way! Luckily, Tableau now has a feature called "Split" that nearly does the same thing. In this example, I want a column that says just the year, for example "2001" instead of "2001 Jobs." To do this, I clicked on a dropdown menu and chose "Split." BOOM. We now have a cleaned up column with just the year in it.
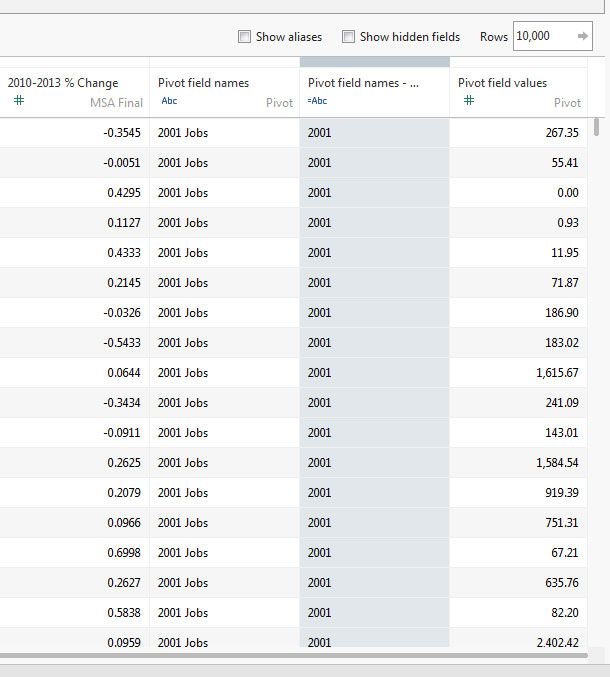
Now everyone can do the splits!
Other Cleanup
Sometimes, you are working with a dataset that has a codebook, or you just did a bunch of pivots and splits and your column names are all wonky. Another great feature of the data connection experience is the ability to view the metadata of your columns and edit them easily. All you have to do is click the list button right next to the Copy button above the table. From here, you can click on the dropdowns on each dropdown to rename them to something friendlier or hide unnecessary variables.
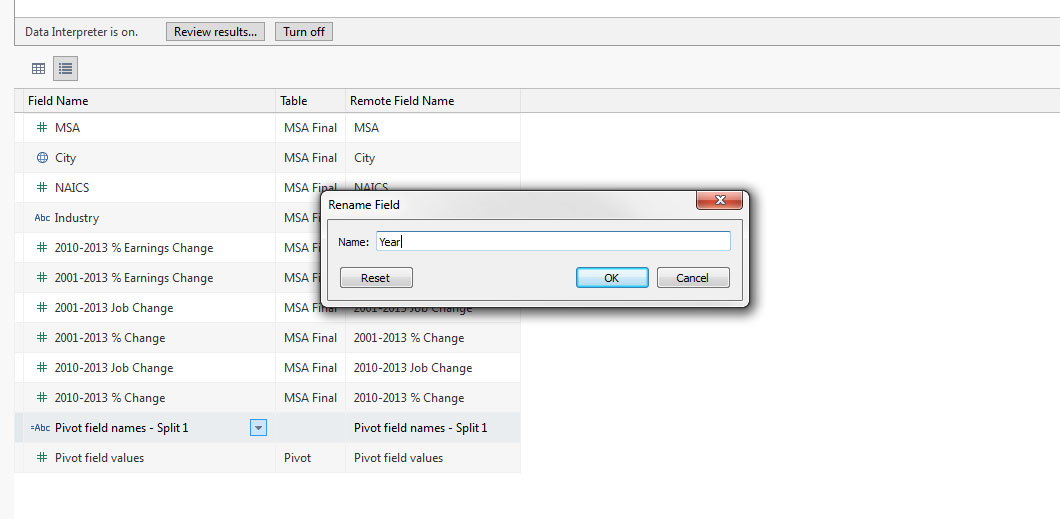
No one wants to see a timeline based on "Pivot field names- Split 1"
I used to think data cleanup was a drag and would often put off projects that required it. Luckily, with Tableau's new 9.0 data cleanup features it doesn't have to be a depressing time-sink anymore. Data is fun and easy again! If you'd like to try out the new data cleanup tools, try it with the dataset from this blog post!
Historias relacionadas

Meet Iron Viz 2024 Finalist Jessica Moon
 15 Abril, 2024

Meet Iron Viz 2024 Finalist Pata Gogová
8 Abril, 2024

Student to BI Analyst, How Tableau Can Lead to a Successful Data Career
 20 Marzo, 2024
Suscribirse a nuestro blog
Obtenga las últimas actualizaciones de Tableau en su bandeja de entrada.