Best of the Tableau Web: December 2020
Happy New Year! Welcome to another year of reviewing the Best of the Tableau Web (BOTW). Can you believe we’re entering the 10th year of this blog series? I personally want to thank every person who shared a tip, detailed technique, analytics that inspired them, or some wacky piece of data art. The Tableau ecosystem has significantly grown in the last decade, and I still enjoy seeing what new ideas are created every month, plus get excited thinking about what may come in the future.
Kicking off 2021, there are some changes and I’m delighted to announce that Mark Bradbourne is joining forces with me. Like me, Mark is an ex-customer whose passion for Tableau and the community led him to work here. You can find Mark on LinkedIn, Twitter, and on his Sons of Hierarchies blog. He’s also running “Real World Fake Data,” a great new project where you can build real-world visualizations.
We’ll take turns curating each month’s list, so look out for his first post in early February.
Of course, BOTW isn’t about us, it’s about you and the data content you create.
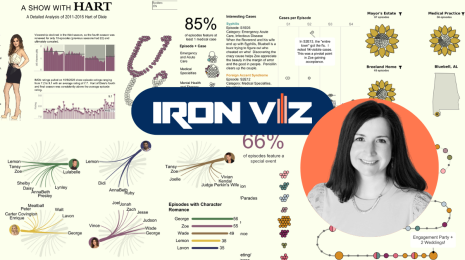
I thoroughly enjoyed Anna Foard’s description of going from data to story. One of the biggest myths about data and analytics is that it’s all about the dashboards. That’s far from the truth. To find insight and drive change requires data exploration, iteration, and finally communication. Anna’s post is an inspiring example of this.
Anna Foard’s From Data to a Story
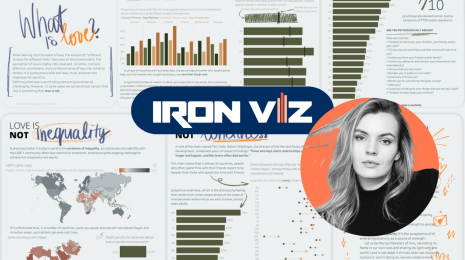
New Year’s reflections and ambitions are top-of-mind for many. Jiselle Howe reflects on her 2020 experiences and learnings, plus shares her 2021 ambitions. Successful analytics is a mix of science, creativity, and communication, and Jiselle has a diverse set of plans to improve in all of those areas. Do you have similar plans?
As always, enjoy the list! Follow me on Twitter and LinkedIn as I share many of these throughout the month, which I hope leave you inspired and informed. You can also check out the blogs I follow here. If yours isn’t on the list, add it here.
Tips and tricks
Eric Parker Create Lines with Different Shapes in Tableau
Anthony Smoak How to Filter your Tableau Viz in Tooltip (Top 10 Values)
Lindsay Betzendahl Monday Minis: Show/Hide Labels Parameter
Marc Reid Five Ways to use Images in Tableau
Kevin Flerlage 2020.4 - An AMAZING New Feature that Tableau Didn't Even Tell Us About!
Inspiration
Jisell Howe 2020-2021: Looking Back and Looking Ahead
Adam McCann Zoomable Dashboard
Toan Hoang Animated Chess Tutorial in Tableau
Anna Foard From Data to a Story
Adam Mico An Interview with Priyanka Dobhal (a Tableau DataFam community star)
Prep
Tom Prowse Output to a Database from Tableau Prep
Server
Ravi Mistry Project Griffon - Pre-built Admin Views: Reloaded
Mark Wu Governed Self-Service Analytics: Performance Management
Historias relacionadas
Suscribirse a nuestro blog
Obtenga las últimas actualizaciones de Tableau en su bandeja de entrada.


