Best of the Tableau Web: Reflections, predictions, and plans
This month, Andy Cotgreave reflects on contributions from the Tableau community as a whole and shares his favorite community-made content from December.


Welcome to 2020! A new decade lies ahead, and with it, more great content from you, the Tableau community. In this month’s review, I’ll start with a moment of humility—and an apology. Brandi Beals’ first post in 2 years was titled “When Andy Cotgreave calls you out.” She recounts how, upon meeting me at Tableau Conference in Las Vegas, my first words were “Hi Brandi, It’s great to finally meet you. You stopped blogging.” On reflection, I can see how that might be a more intimidating opening to a conversation than I had intended! Brandi – I apologise if I freaked you out. If it started a new thread of creativity, then I’m glad for the happy accident.
A more general reflection from reading Brandi’s post is about how I curate this series. I enjoy everyone’s posts and especially look forward to posts from excellent writers. To every single one of you who writes a blog or records a video: thank you. If all you ever do is make one piece of content: well done. If other things get in the way: rest assured, that is fine with me! Life doesn’t start and end with Tableau, and I value everyone’s contributions—whatever their frequency.
With so many projects and opportunities to get involved in the Tableau community, it can feel overwhelming when thinking about where to start and dealing with the pressure of content creation. Our lives are busy and we have to make difficult choices on where to focus. To anyone who is a content maker: if it ever feels like a burden, take a break.
This month’s list looks at the best posts from December, so there is a lot of reflective and predictive content. Adam Mico curated an incredible set of reflections on the Tableau community and believe me when I say this post was extensively shared here at Tableau. The passion that you all bring to the community is what keeps us driven to extend our platform.
If 2020 feels like it’s your year to get involved, check out his post and then look at some of the community activities you could get involved in.
Tips and tricks
Andy Kriebel #TableauTipTuesday: How to show axis marks only at the top of a scatter plot
Bridget Cogley Relational-ish: JSON, Tableau, and the Power of Sets
Timo Tautenhahn Show Empty Rows and Columns
Timea Demeter 5 Tableau Tips that will make your life easier
Lorna Eden #TABLEAUTIPTUESDAY WEEK 51 – 12 DATES OF TABLEAU
Rajeev Pandey Tableau Performance through Referential Integrity
Spencer Baucke 4 Tips for Organizing Your Tableau Worksheet
Jim Dehner How-To Create a Normal Distribution Chart
Hanna Nykowska Tableau Tip: the INDEX trick
Molly Hatch What are Measure Names and Measure Values?
Jeffrey Shaffer Truncating the Axis and a Concept Redesign
Eric Parker Creating Dynamic Labels for End Users
Lindsay Betzendahl Creating Show/Hide Container Buttons
Dustin Wyers Advance with Assist: Getting Show/Hide Buttons to Appear in Tableau Desktop
Inspiration
Tim Ngwena Animations vs transitions: what's the difference?
Neil Richards How can we visualise decimal numbers?
Sarah Bartlett #IronQuest – Year One in Review
Preppin' Data Team How to... explain 'Why Self Service Data Prep'?
Ken Flerlage Introducing FlerlageTwins.com!!
Andy Kriebel The Great Workbook of Table Calcs, LODs, and Actions
Brandi Beals When Andy Cotgreave Calls You Out
Robert Curtis New Year’s Resolution: Tableau Tips to Go from Junior to Jedi
Toan Hoang Tableau Twelve-Step Programme for 2020
Mark Bradbourne The Tableau Community – What, Where, Who, When, How, and Why?
Kevin Flerlage My Makeover Monday (Guest Post)
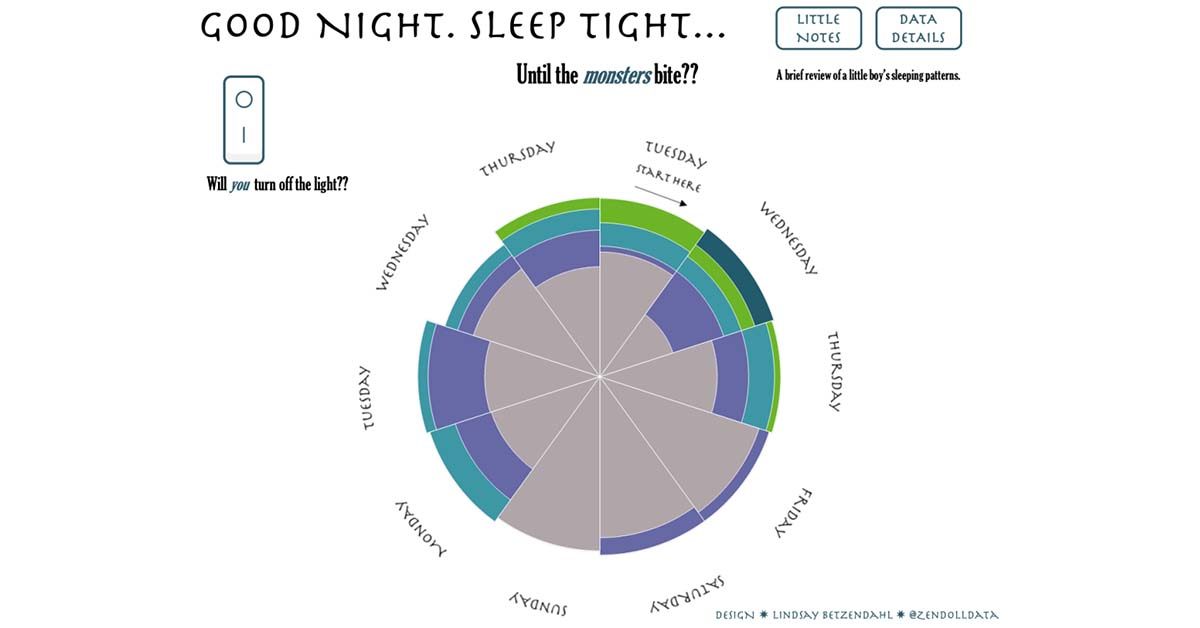
Bridget Cogley The Most Meaningful Viz
Marc Reid Animated Transitions in Tableau
Lindsay Betzendahl #MomsWhoViz: Karen Hinson
Calculations
Rajeev Pandey Level of Detail Expressions in Tableau
Andy Kriebel #TableauTipTuesday: How to Use Level of Detail Expressions to Find the Bounding Rectangle of a Line
Jim Dehner Use LODs to create layer in your data set
Rosario Gauna HOW TO SORT ASC/DESC BY SELECTING A DIMENSION OR MEASURE WITH PARAMETER ACTIONS
Formatting, design, and storytelling
Eric Parker Efficient Filter Layout for Tableau Dashboards
Lindsay Betzendahl Using Preattentive Attributes: Color in Data Viz
Ryan Sleeper How to Make Your New Favorite Commenting System in Tableau
Jeffrey Shaffer Text Alignment on Dashboards
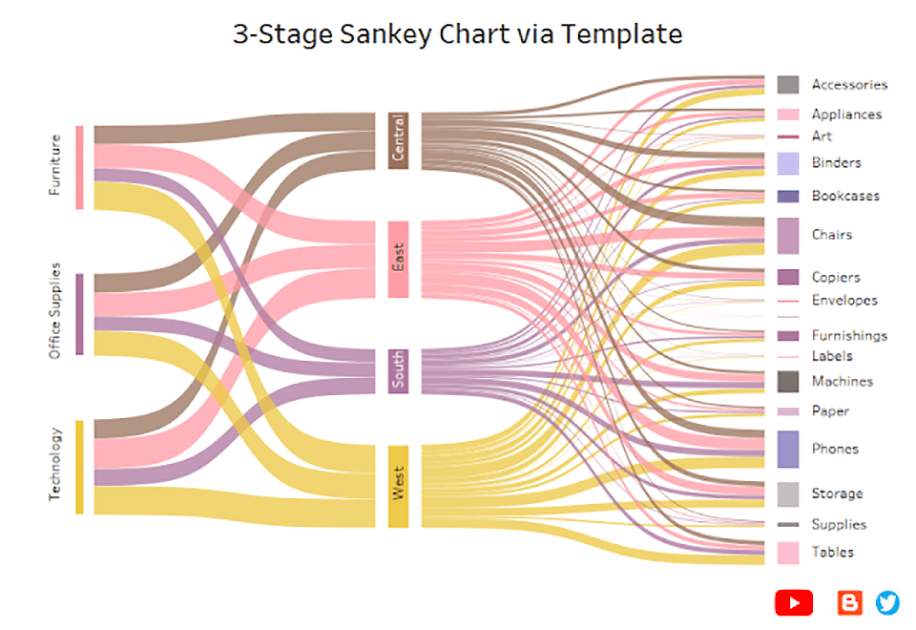
Alexander Mou Creating a 3-Stage Sankey Chart via Template
Ludovic Tavernier How to build Curvy Line Charts in Tableau Software
John Emery Using Tableau to Analyze the 1969 Vietnam War Draft Lottery
Steve Wexler Simple Synchronized Scrolling in Tableau
Luke Stanke Rethinking Slider Parameter Formatting in Tableau
Chris Love Creating UpSet Plots in Tableau
Set and parameter actions
Lorna Eden #TABLEAUTIPTUESDAY WEEK 49: PROPORTIONAL BRUSHING USING SET ACTIONS
Robert Crocker How to Create Custom Date Filters with Parameter Actions
Joshua Milligan Parameter Actions + Geospatial Functions = Tableau Awesomeness!
Gloria Montgomery Parameter Actions #2: Creating a Top/Bottom N Parameter to Filter Dynamically
Jim Dehner Use sets and set actions to navigate your next viz
Luke Stanke Improving Parameter Design in Tableau
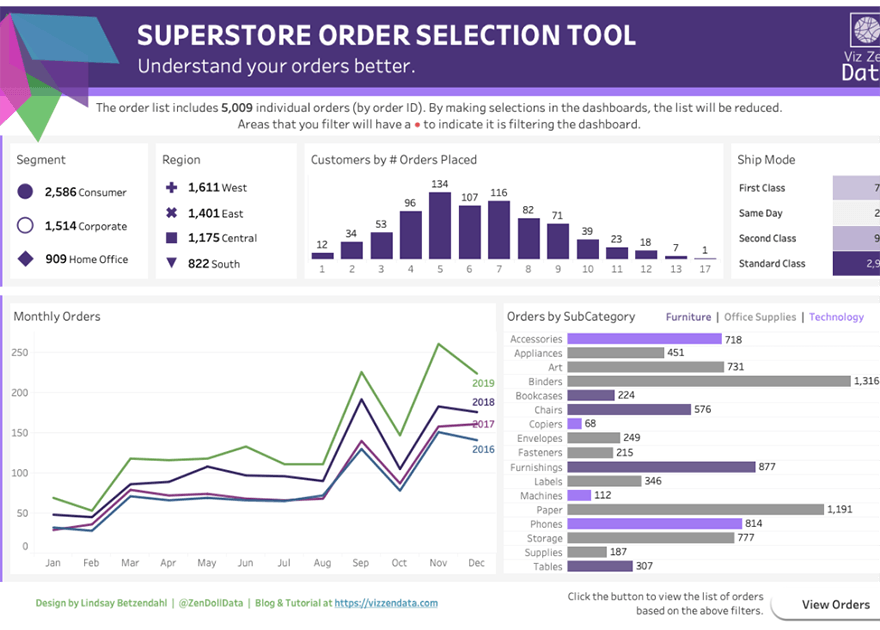
Lindsay Betzendahl Using Set Actions as a Filter Indicator
Bryant Howell PASSING A JWT AS A TABLEAU PARAMETER
Tableau Prep
Eric Parker How to Deal With Multi-Response Survey Data in Tableau Prep
Carl Allchin How to...Filter
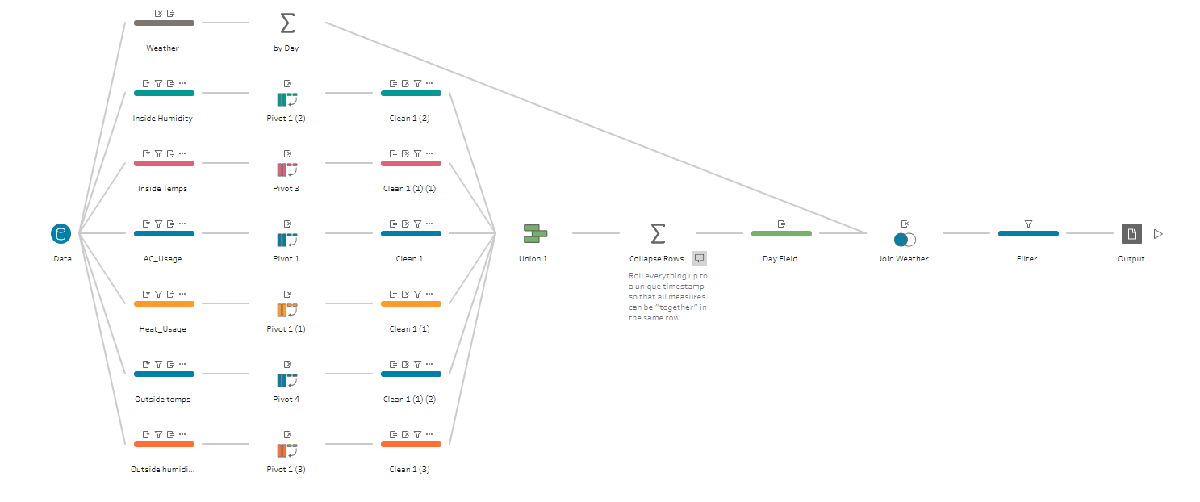
Joshua Milligan Tackling Nest thermostat data with Tableau Prep
Historias relacionadas

Meet Iron Viz 2024 Finalist Jessica Moon
 15 Abril, 2024

DataFam Roundup: April 8–12, 2024
 12 Abril, 2024

Meet Iron Viz 2024 Finalist Pata Gogová
8 Abril, 2024
Suscribirse a nuestro blog
Obtenga las últimas actualizaciones de Tableau en su bandeja de entrada.