Citizen Scientists Tackle Government Data for Public Health


The story of how two strangers became friends and award-winning citizen scientists starts with a months-old tweet:
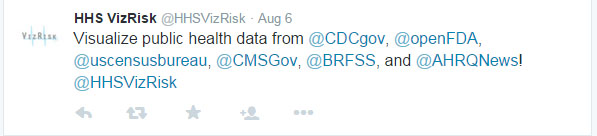
Ken Patton, an operations manager for a large tech company near Raleigh, NC saw this tweet and was intrigued.
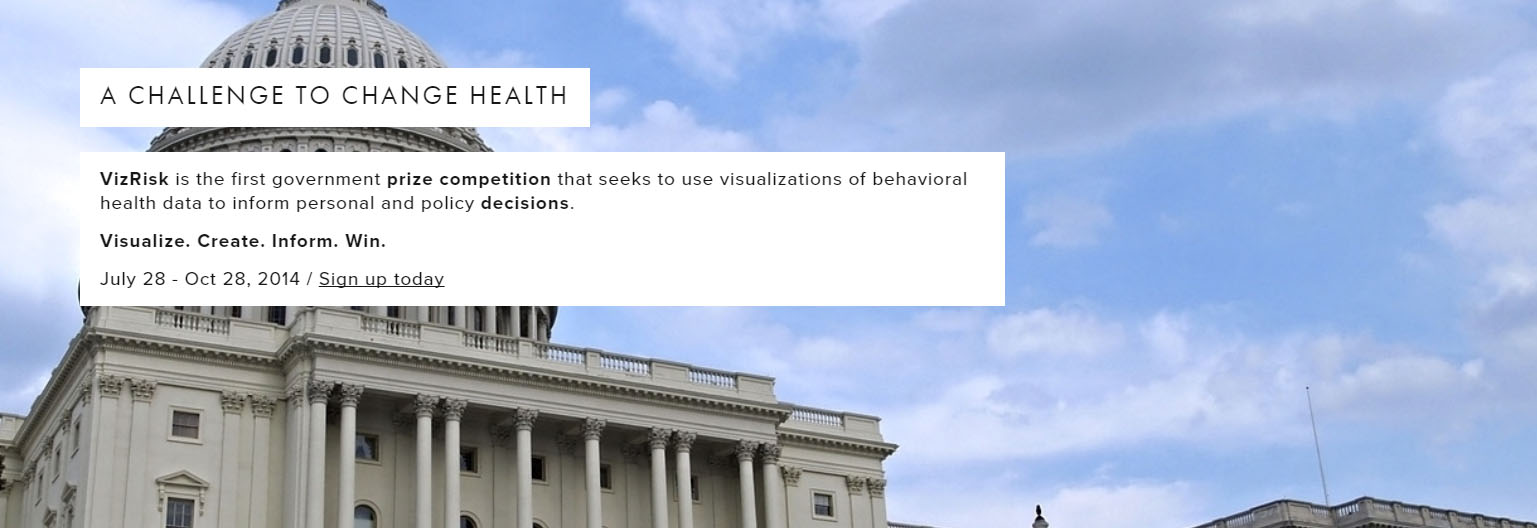
VizRisk is the first-ever open competition for data visualization sponsored by the US Department of Health and Human Services (DHHS). By now, the deadline was only a month away, but that didn’t worry Ken. Organizations including the Centers for Disease Control (CDC), Centers for Medicare & Medicaid Services, and the Food and Drug Administration (FDA) provided data sets. All Ken had to do was build visualizations—a task he does routinely at work.
But Ken doesn’t have a background in behavioral health or life sciences, and he wasn’t confident he could truly interpret the data. The BRFSS data he had to visualize was in an unfamiliar format with no clear means of extracting understanding. Ken was stuck.
It Takes Two to Make a Viz Go Right
The answer presented itself a few weeks later at a Tableau User Group (TUG) meeting. One of the other presenters that night was Dr. Heather King, a senior scientist and data communication specialist at MDB, Inc.
Heather’s focus is environmental health science and she has deep experience working with health data sets, thanks to her years working with the National Institute of Health.
“As soon as Dr. King began showing the work she is doing, it was immediately clear that she was exactly the expert I needed,” Ken says.
Ken asked if they might work together on the VizRisk contest.
Heather agreed and they met at a coffee shop the following Sunday, a mere nine days before the deadline.
“I initially tried downloading the data as a .CSV,” Heather remembers. “It was so big I couldn’t even open it in Excel.”
Instead, Ken used a free, online ETL tool to process the data and put it into a SQL database. Heather and Ken decided to use the free Tableau Public tool for this contest.
“There was never any debate that Tableau Public is the best solution for efforts like these,” Ken says. “Not only is it the perfect platform for making open government data consumable for a mass audience, but it’s a way for other Tableau experts to leverage the work of others. Anyone could download our data set and make even better things from it.”
9 Days + 2 Experts = 1 Winning Viz
Working only on evenings and weekends, the two quickly put together a visualization analyzing outcomes by prevalence across a number of demographic factors including geography, gender, age, and activity levels.
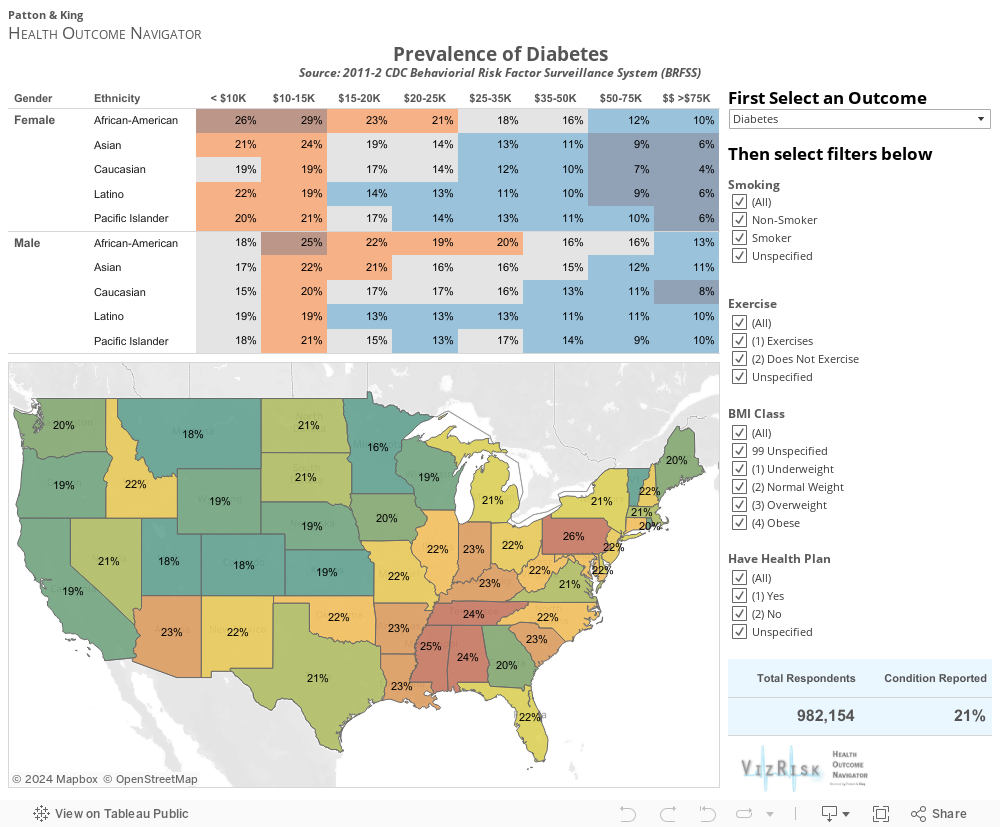
“We did this with a free database, free ETL tool, the free Tableau Public, and my laptop, which is a $300 beater I bought used. We didn’t have any specialized tools beyond our skills,” Ken points out. “We call ourselves citizen scientists.”
The DHHS judges were impressed with the results these citizen scientists came up with. They awarded Heather and Ken not only the Grand Prize, but also the Design and Relevance awards.
As the VizRisk webpage explains the decisions, “The clean, simple presentation style belies the sophisticated, modular architecture behind it. Within minutes we can remove or add any data fields from over 580 stored in our dedicated database. We can also rapidly add new outcomes, views, tables, chart types, filters, and other features.”
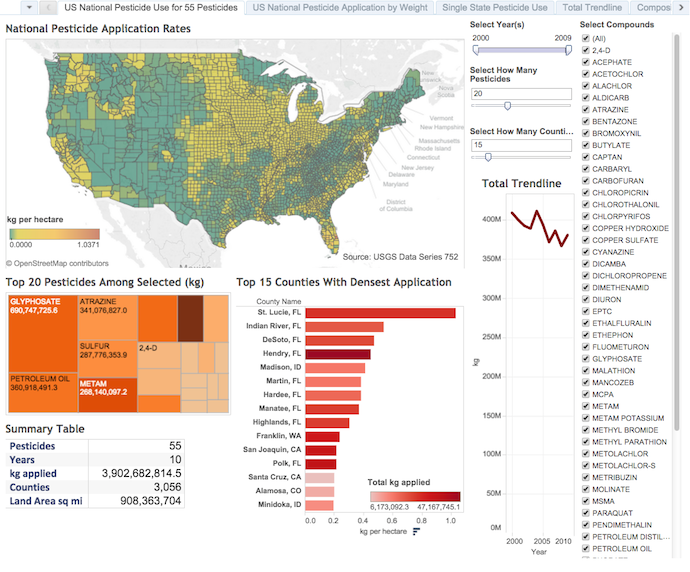
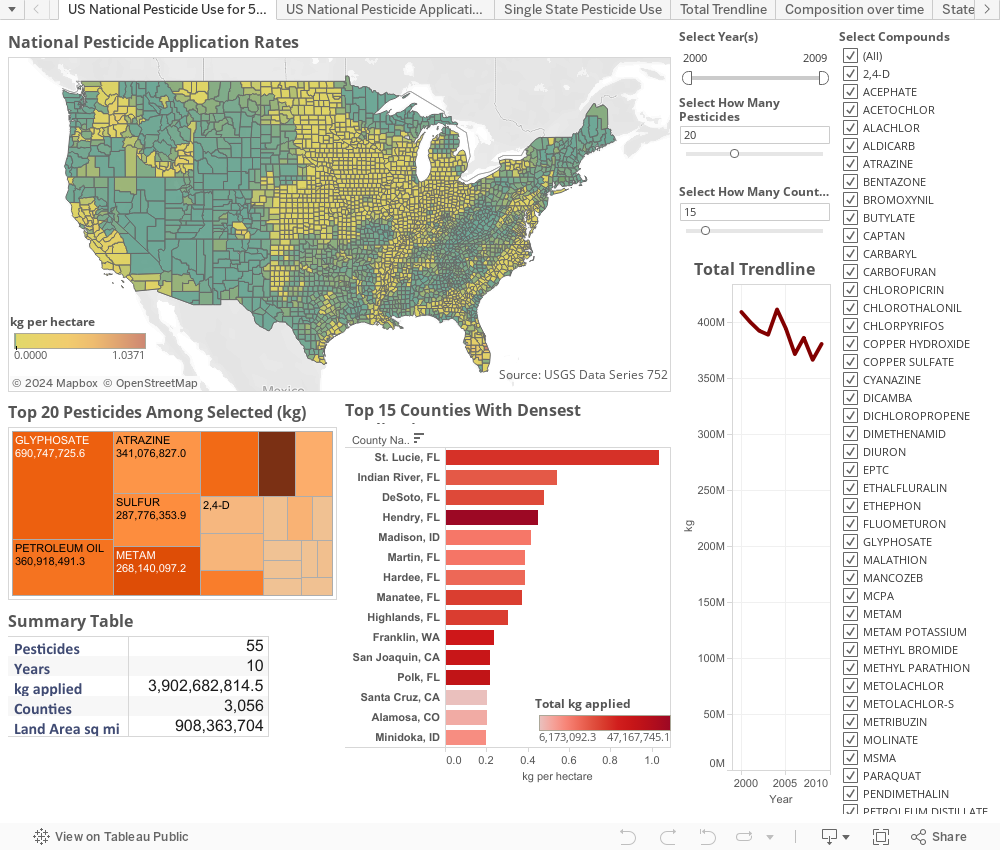
And for Heather and Ken? The citizen scientist duo is now tackling pesticide application data.
“With the open government movement, I think you will see more and more of this sort of movement—to really open up the data and share with citizens. Of course, you will always have some data that needs to be kept private for good reasons, but we are already seeing more openness with data.gov. And it’s just beginning,” Heather says.
Sounds like these citizen scientists are just getting started.
Suscribirse a nuestro blog
Obtenga las últimas actualizaciones de Tableau en su bandeja de entrada.