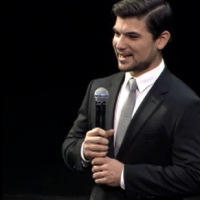
Ryan Sleeper is Our Iron Viz Champion!!!
The Third Annual Iron Viz Championship has come and gone, and it was a battle for the ages. Our three Tableau Public contest winners, Ryan Sleeper, Jim Wahl and Kelly Martin attempted to better each other with a DataSift extract of 1-10 movie ratings on Twitter. All three created fantastic visualizations, but Ryan Sleeper narrowly defeated his opponents to clinch the title of Iron Viz Champion, $2000 and eternal glory.
It's hard to explain what the Iron Viz is like, but I will try to illuminate it as best I can. Picture yourself in a darkened room overflowing with people. The stage is set, the data is loaded, and our contestants wait backstage as the room fills with haze, penetrated only by orange and blue lights. Ominous music begins and the contestants march towards the stage... and their impending challenge. Everything has come down to this, an entire year of visualizations and hundreds of vanquished opponents. And then, after a short introduction, the call of "Aiiii viz" fills the room and the contestants begin creating their visualizations.

The contestants enter the room.
The contestants at work.
This year, the data that the contestants used was a (truly amazing) 32MB set from DataSift that compiled every social media mention of a 1-10 movie rating over the past year. Immediately after beginning, the contestants rushed to clean the data with tools that would help them sift and parse the data in a way that would allow them to display the information in a way that made sense to them. Ryan started with parameters, Jim a bin, Kelly a text calculation to parse out the names of Zombie movies.
During the competition, the crowd began to tweet their votes for each contestant.The audience reactions were quite illuminating, with many pointing out that the contestants had created their visualizations in a spectrum. Kelly (on the right) was the most visual and artistic with her view of Zombie movies, Jim (center) was the most analytically deep with a viz that showed the standard deviation of ratings (among much more). Ryan filled the middle ground with a view that showed how movie ratings increase with the age of the movie. It was this pithy finding, and its beautiful presentation that wowed the judges and won over the audience. Take a look below!
You can also take a look at Kelly's visualization here. Unfortunately Jim's was lost after the competition, but you can get some sense from the image above what his view looked like.
Thanks to everyone who participated in the contest, and remember it could be you on stage next year! Keep an eye out for our 2014 Tableau Public contests for your chance to participate.
Suscribirse a nuestro blog
Obtenga las últimas actualizaciones de Tableau en su bandeja de entrada.


