
A good business dashboard gives information at a glance. A great business dashboard combines high performance and ease of use to let anybody get data-driven answers to their deeper questions. Dashboarding with Tableau allows even non-technical users to create interactive, real-time visualisations in minutes. In just a few clicks, they can combine data sources, add filters and drill down into specific information. Sharing a dashboard requires no programming, whether it’s on Tableau Server, Tableau Cloud, or any portal or web page. The best part is that Tableau can connect to multiple data sources, providing new opportunities for discovering new insights hidden in your data.
Solutions
Business dashboards
Tell your data story with a dashboard.
Going from good enough to great
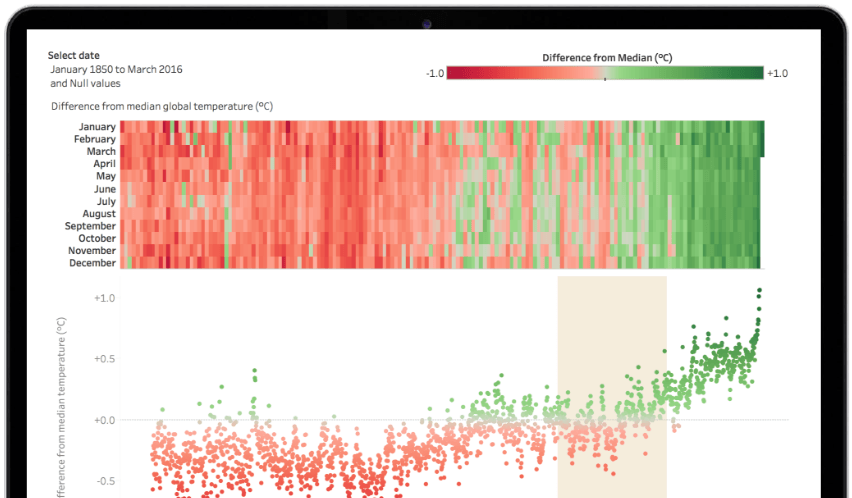
A quick guide for better data visualisations
Great visualisations will not only help you understand more about your data, they’ll offer faster, more meaningful answers, and even inspire others to ask and answer new questions.
Learn moreWhen we took the first dashboard done in Tableau to the first meeting with the executives, some were so surprised that the reaction was mostly silence. One of the executives said, 'I always asked for that in the BI area and finally they managed to do it.'
Built-in features made for advanced dashboarding
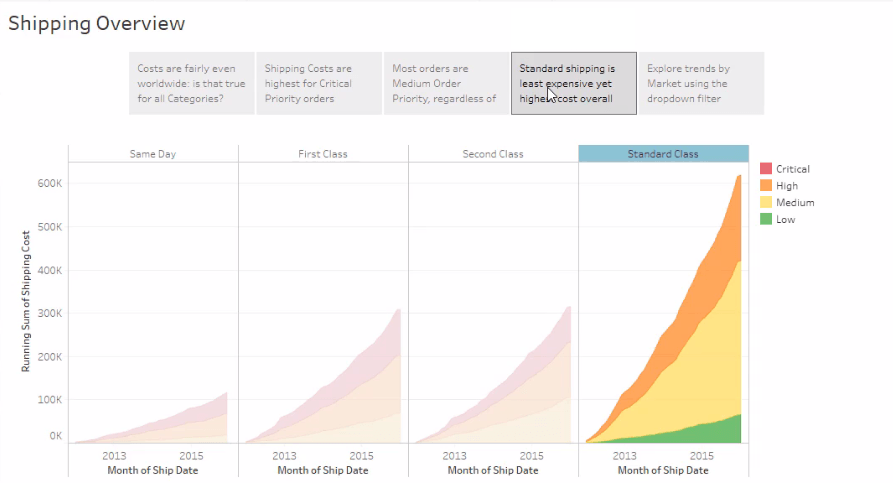
Story Points
A good data story brings data and facts to life. Use Tableau's built-in Story Points to walk your audience through the data and insights you want to make sure they see.
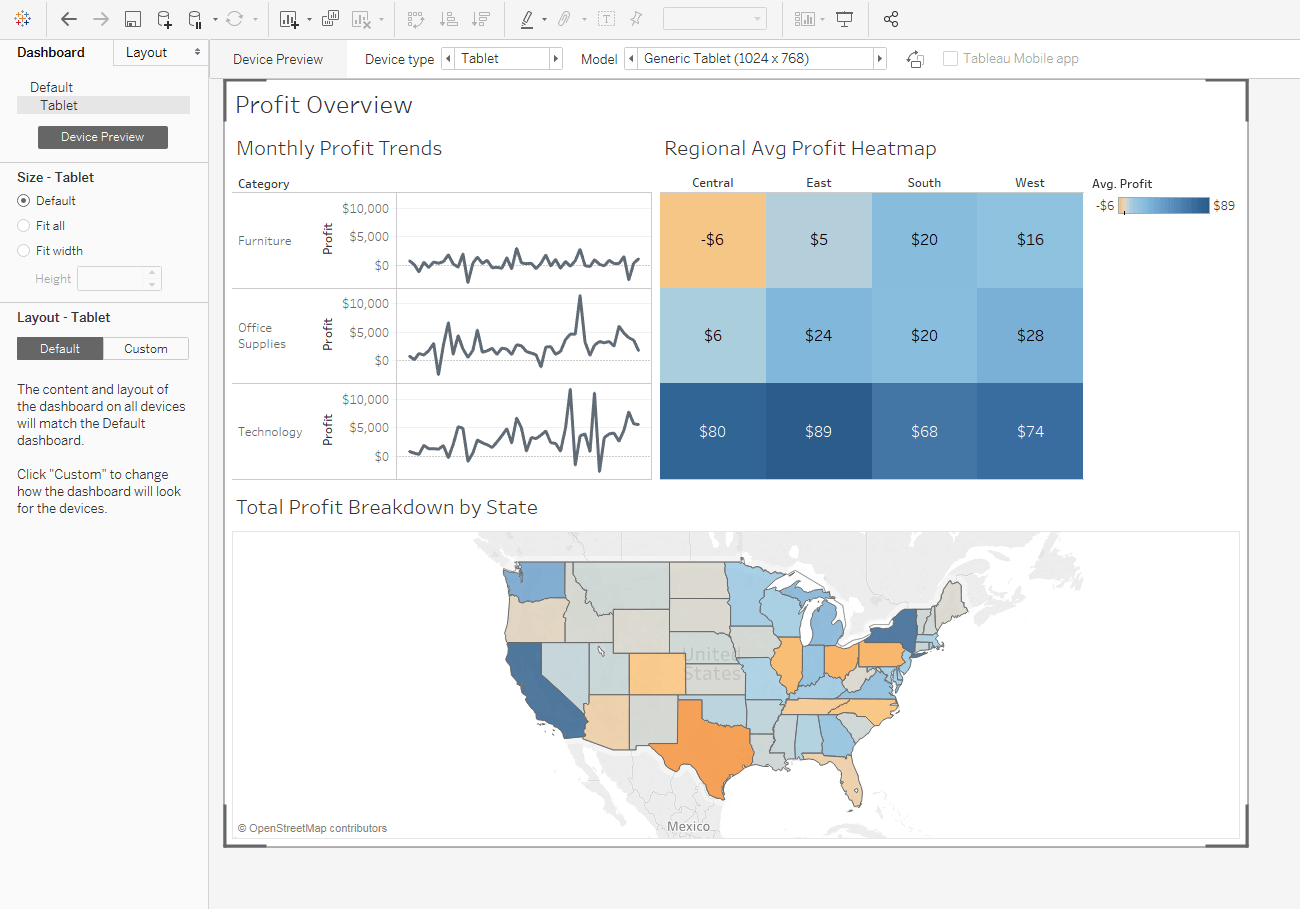
Device Designer
A dashboard should be consumable no matter where or how the viewer is looking at it. With Device Designer, you can make sure that whether your dashboard is being viewed on a phone, tablet or desktop, the experience will be optimised.
More resources
icon--online-classes">
On-demand webinar
My Tableau Story with Visionary "Tableau Tim" Ngwena
icon--online-classes">
On-demand webinar
My Tableau Story with Visionary Diego Parker
icon--online-classes">

icon--whitepaper">