
Welcome to Tableau
You'll find all the resources you need to get started as an Explorer
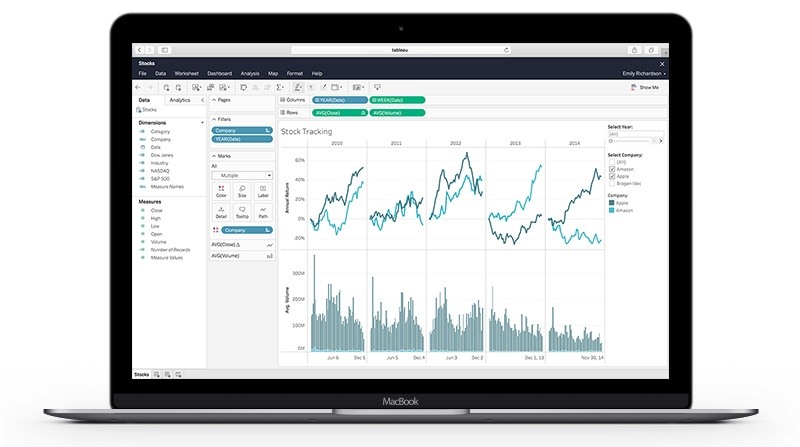
What is Tableau?
Tableau offers a suite of products for business intelligence that scales actionable, data-driven insights everywhere, for everyone.
See Tableau in actionStep 1: Get to know your site
Take action and keep data at the heart of every decision, right in the flow of work. When you sign into Tableau, the first page you see will include the Projects, Workbooks, Views or Data Sources menus. As you click these options, each page will show related content you can access. As Creators and Explorers share workbooks, your site will begin to build a content library full of useful data. Exploring this content is easy.
Search for content
The quick-search field at the top of the page searches your entire site. Filter your search to find matches that are specific to each resource type, such as modified date for workbooks or connection type for data sources. You can also find workbooks or views that you've marked as favourites. Both quick search and filtered search support attributes to help set the scope of the search.
Browse for content
Navigate through your site to find the data that will help you better ask and answer questions. In the navigation bar, move from Projects to Workbooks to Views to Data Sources to find what you’re looking for.
Step 3: Stay informed
Find favourites
Favouriting content makes it easy for you keep an eye on the data you need. To favourite a view, click the star to add the content to your favourites list. You can then quickly access your favourites from the top navigation whenever you need them. Mark your favourites
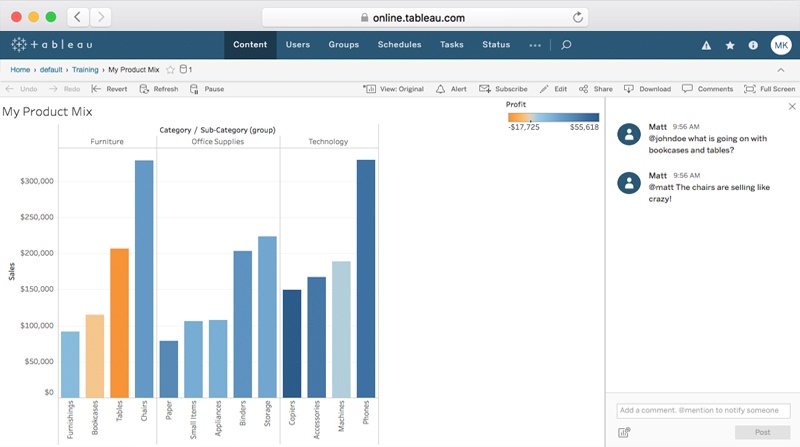
Subscriptions
Using the Subscribe button in the toolbar, you can subscribe to dashboards and get updates delivered directly to your inbox on a set schedule. You can also subscribe other site users if you have the permissions to do so. Subscribe to your favourites
Data-driven alerts
Data-driven alerts help you keep on top of your most important data. Get an email when a mark crosses a visual threshold. First, select the axis you want to get alerts on. Then click the Alert button in the toolbar. Finally, choose the trigger condition and when to send it. Set up an alert
Mobile app
The Tableau mobile app is a convenient way to keep your data at your fingertips. Go from question to insight in just a few taps. Ask your own questions; seek out the answers you care about. Select, filter and drill down with a tap of your finger. Interact with your data using controls that are automatically optimised for touch. Download for iOS and Android.
Step 4: Build something
As an Explorer on your site, you share the responsibility with creators to create new content on your site. You can either start with an existing workbook that’s already on your site or start building from scratch.
Start by editing
Navigate to a workbook on your site and open it up. Select the pencil icon next to the workbook title to edit the view.
Edit a view
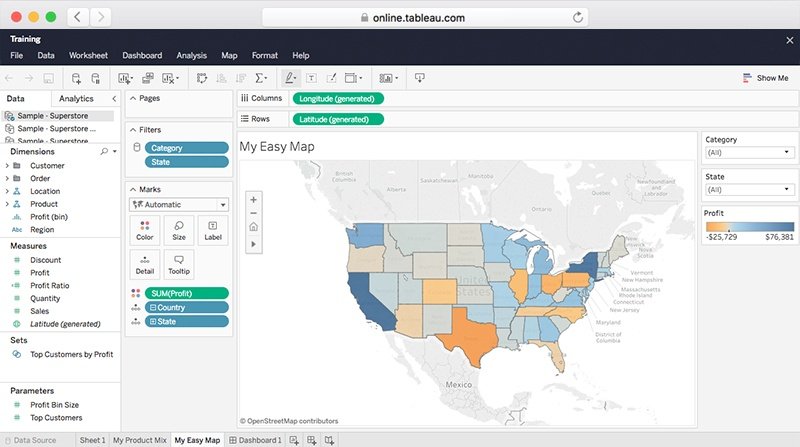
Start from the data
As an Explorer, you’re able to answer your own questions by exploring data right in the browser. Start by selecting Workbooks from the top navigation. Then the Connect to data window will appear. Connect to published data sources from the On this site tab and select your chosen published data source to start building something amazing.
Build a workbook using an existing data source
Use natural language to get answers from your data
Ask Data is a powerful way to interact with your data. Simply type a question and get an answer in the form of automatic data visualisations. Use Ask Data to get started quickly and iterate on your analysis without drag-and-drop or understanding the underlying data’s structure.
Build views with Ask Data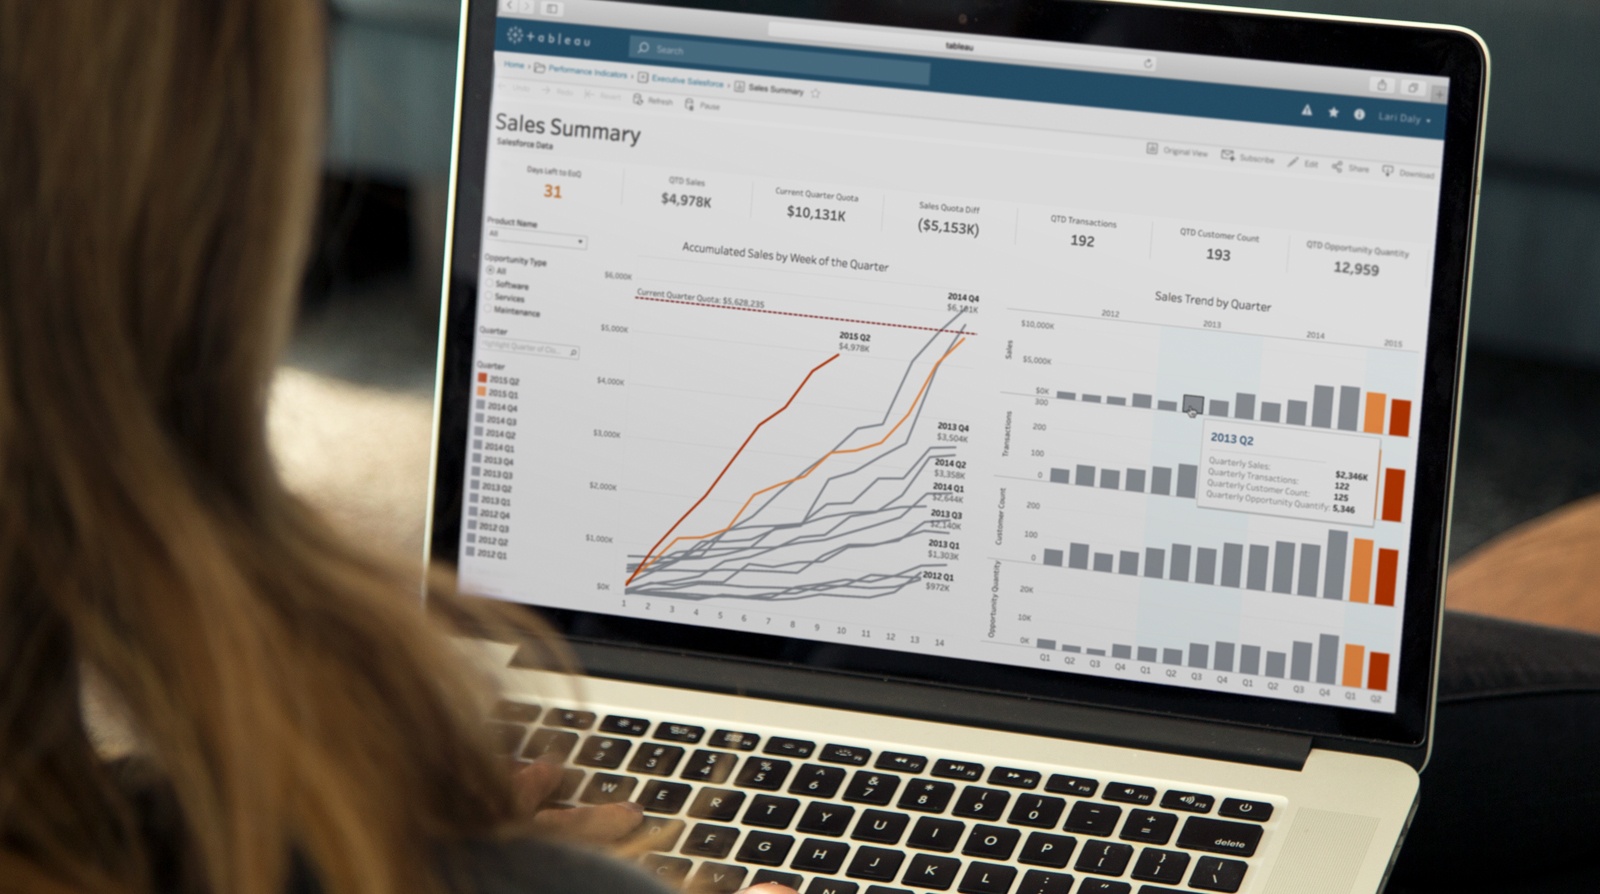
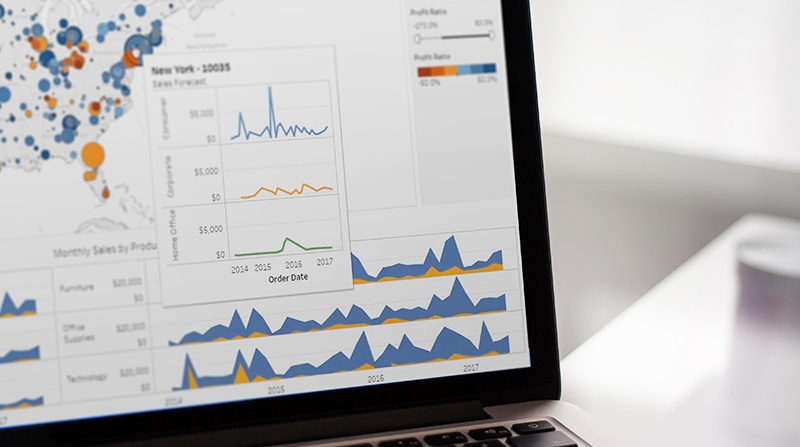
Build with visual best practices in mind
Discover ways to improve your visualisations to increase understanding about your data and enable faster, more meaningful answers.
The most important step you can take to make a great visualisation is to know what you’re trying to say. It is vital that your visualisation has a purpose and that you are selective about what you include in your visualisation to fulfil that purpose. Below are some tips for applying visual best practices to your workbooks. Check out the white paper for the full list of tips.
Tableau visual guidebookKnow your audience
When you’re building a visualisation, it’s important to understand what questions your audience already has. What answers do you find for them? What other questions does it inspire? What conversations will result? Your viewers should take something away from the time they spend with your visualisation.
Choose the right chart type
Understanding what you’re trying to convey in your visualisation is a critical first step. Knowing which visualisation can best convey that purpose is equally important. Whether you’re trying to see trends over time, or comparing and ranking a group of items by a set of criteria, the chart type you choose will help your audience better comprehend the information in your visualisation.
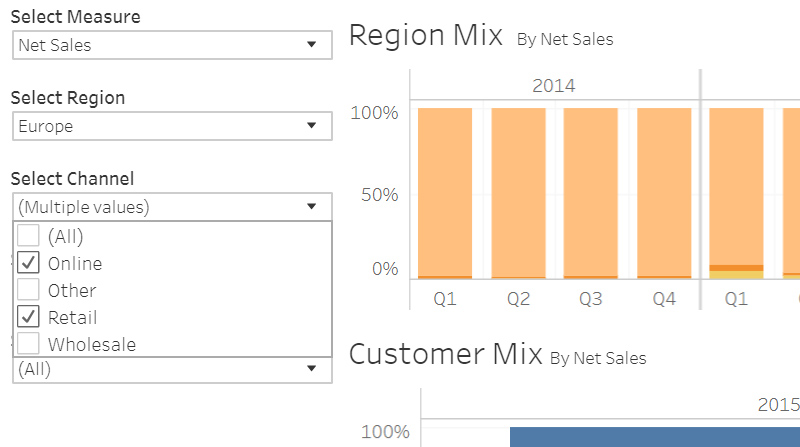
Emphasise the most important data
Many chart types let you put multiple measurements and dimensions in one view. In scatter plots, for example, you can put measurements on the X or Y axis, as well as on the marks for colour, size or shape. A rule of thumb is to put the most important data on the X or Y axis and less important data on colour, size or shape.
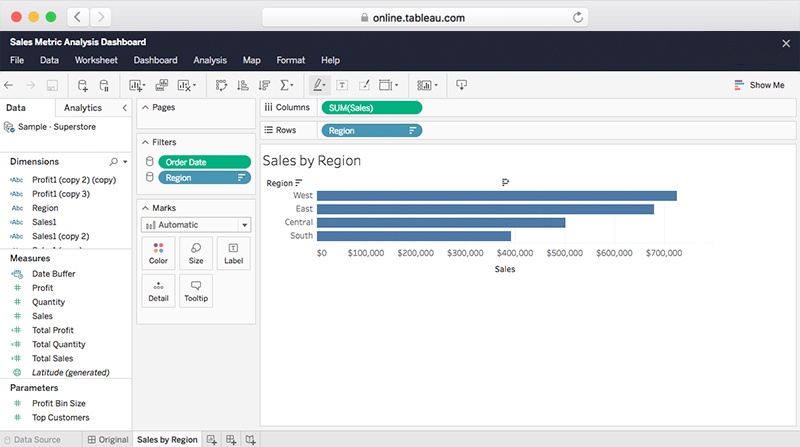
Orient your views for legibility
Sometimes a simple change in how your labels are oriented can greatly increase how quickly viewers understand what’s being conveyed. If you find yourself with a view that has long labels that only fit vertically, try rotating the view. You can quickly swap the fields on the Rows and Columns shelves to achieve this change.
Step 5: Share and collaborate
Share workbooks and views with colleagues
Sharing is caring. Don’t keep your insights to yourself. Share them with colleagues.
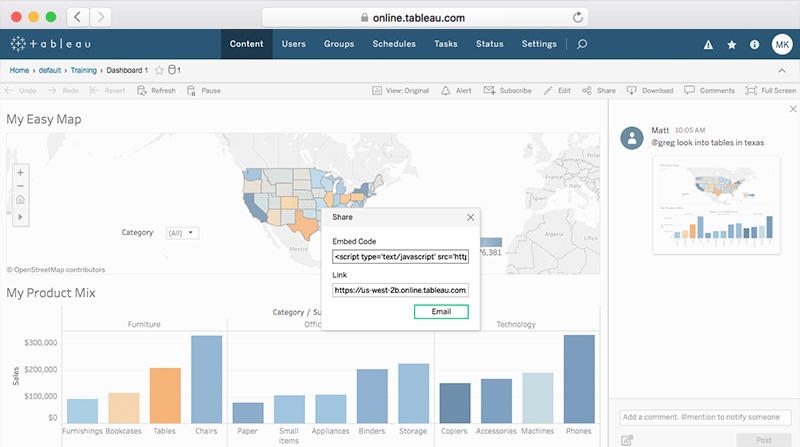
Sharing views with members of your site is easy. Maybe you want to show a colleague a specific viz within your workbook. It’s easy to share links with others by pasting them into an email. Simply click the share icon in the toolbar, copy the URL in the Link field and paste it into your email.
If you want to be more targeted in what you share, try sharing a custom view. Rather than sending a link to the original dashboard and describing how to find your specific insight, you can save the specific set of filters and highlights you’ve already created in Tableau. When you are ready to save your custom view, click the Original view button in the toolbar. Give your custom view a name and click Save. Now your team can easily access your custom view by selecting it from the list in the Original view menu. You can also copy and share the URL, just as you did above.
Learn, connect and grow with the DataFam

Looking to get your Tableau questions answered or bring your data skills to the next level? Get started in the community with just a few steps.
- Visit our welcome page
- Watch My Tableau story for actionable advice from inspiring community leaders
- Sign up for community updates