The Data Culture Playbook
How your organization can achieve more with a data-first mindset
Introduction: Measuring the business impact of data culture How to use this playbook Download the PDF
Data is no longer just a competitive advantage, it is critical to the health – and often the survival – of an organisation. This playbook is intended for executives and data leaders who want to realise the full value of their organisation’s data by building a data culture where every individual is equipped to tackle even the most complex business challenges using analytical insights.
Introduction: Measuring the business impact of data culture
Challenges from unexpected crises reveal that agile, strategic use of data greatly impacts an organisation’s ability to respond to market changes. But getting the most out of your data requires more than just technology. It requires a commitment to promote data-driven decision making at every level, based on a defined analytics strategy that connects technical deployments with business objectives, processes and people.
Despite the trillions of dollars invested in data and analytics in recent years, leaders are still unable to create a data-driven culture and deliver on their analytics investments.
According to a NewVantage Partners’ 2021 Big Data and AI Executive Survey comprised of 85 Fortune 1000 firms:

Ongoing global crises and economic downturns exacerbate these failures to realise data’s value and remind us that businesses need to cultivate behaviours and mindsets that support a data culture – a shared mission to put data at the heart of every decision. Feeling the importance of analytics, companies want to urgently unlock insights to become data-driven.
Even before the pandemic, data-driven businesses were reaping benefits as top performers. Tableau commissioned market intelligence firm IDC to conduct a study* to assess the impact of data culture on business outcomes. Surveying global business leaders across industries, including financial services, healthcare, government, etc., IDC examined how culture contributes to the success of data-leading businesses – those with strong data cultures – identifying trends that set them apart.
Source: IDC white paper, sponsored by Tableau, How data culture fuels business value In data-driven organisations, doc. #US47605621, May 2021.
Compared with just 5.7% of respondents from data-aware companies – those with the least mature data cultures – an average of 73.5% of respondents in data-leading companies said that their decision-making was always data-driven. And data-leading executives are eight times more likely to actively use data themselves compared with leaders from data-aware businesses.
Data-leading executives, who use and understand the power of data, share behaviours and mindset:

Creating a data culture may seem daunting, even in the best of times. It takes a commitment from every level of the organisation to influence how people think about and act on data insights. But the reality is, you can take incremental steps to build these capabilities now, knowing that the action you take has a monumental impact: You'll be able to execute and scale analytics and business strategies, unlocking your data’s value in the near- and long-term.
Are you leading with data?
Find out by asking team members these questions:
- Do people know how to interpret data?
- Can people get help from colleagues with analytics or data-related questions?
- Do we give people access to the data they need?
- Are people accountable for the data they access and create?
- Do we require data to support decisions?
Is your organisation using Tableau? If so, then you have access to resources and guidance to support your data culture journey with Tableau Blueprint. Blueprint is the most comprehensive methodology for becoming a data-driven organisation.
How to use this playbook
This playbook lays out a simple but effective roadmap for building a data culture. It contains four chapters, each with a specific focus area.
![]() Chapter 1: Align leadership metrics to business priorities
Chapter 1: Align leadership metrics to business priorities
![]() Chapter 4: Promote widespread data discovery
Chapter 4: Promote widespread data discovery
For each area, we outline how to make it happen– recommendations on how to build, run, and – when you’re ready – expand and mature these capabilities.
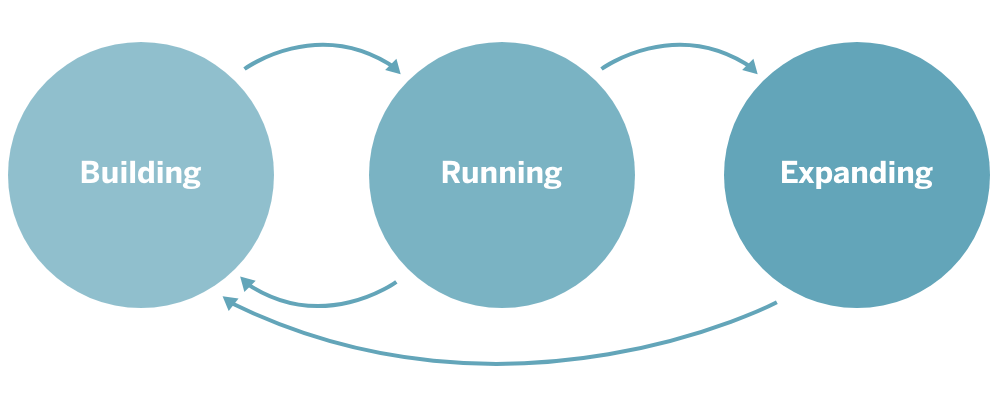
Keep in mind that data culture isn’t linear – it’s a living organism that continuously evolves. We urge you to take a phased approach that makes sense for your organisation’s goals and needs. The steps in this playbook can be executed and repeated, both as a data culture comes to life and after it is thriving.
Are you responsible for scaling Tableau across the enterprise? Explore the proven, repeatable processes outlined in Tableau Blueprint. Across governance, agility, proficiency and community, apply concrete plans, recommendations and guidelines step by step.
Chapter 1:
Align leadership metrics to business priorities
Goal:
Leaders from across the organisation determine where the organisation should be focusing resources around data, as they align on business goals and strategic objectives.
What it looks like:
Leadership-defined strategies and buy-in ensure that individual leaders are all working toward the same goals and assigning data resources to areas that have the biggest impact. Agile organisations assess and re-evaluate key priorities as conditions shift and lessons are learned, keeping long-term goals in sight.
Start with an audit of organisation-wide data use, reviewing the current state against strategic initiatives, desired outcomes and business priorities. To understand how the business is performing against priorities, a data leadership committee creates a key set of metrics and works with the right people – typically an analyst team – to locate, create and align data sources to support these metrics. In this stage, data sources help provide a snapshot view at the leadership level. Ideally, these sources are updated on a regular basis so leaders can define expectations on how a metric should perform. This affects how you prioritise more in-depth data sources for later analyses.

Abercrombie & Fitch creates alignment with real-time data
Abercrombie & Fitch uses near real-time data to guide a quarterly alignment meeting between executives, business group leaders, and product teams. These quick insights help leaders map out goals, align on intent, and determine where they want to focus their efforts.
Read more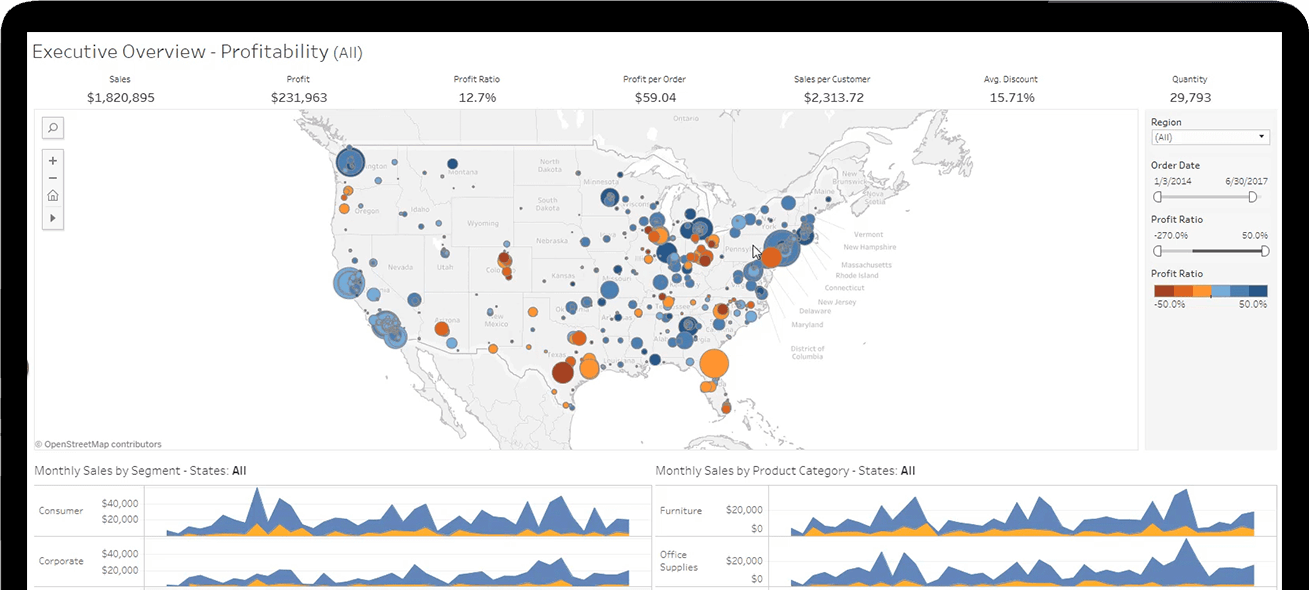
An executive dashboard brings your top business metrics together in one view. This example monitors profitability, product, shipping, performance and order detail all within the same workbook.
Making it happen:
Building a data-driven business requires embedding data across organisations and bringing data to all types of decision-making. The Data Leadership Collaborative connects like-minded leaders to learn from and help one another succeed on their data culture journey.
Chapter 2:
Build data sources to address
critical decision points
Goal:
Business metrics guide prioritisation of data efforts and teams build data sources to address the most critical business questions.
If your data isn’t aligned to decision-making points, the data may be interesting, but it won’t be helpful and it won’t achieve results.

What it looks like:
Data owners and business owners form a “tiger team,” or a cross-functional team dedicated to tackling a specific issue, that works together to identify or create key data sources with a direct impact on organisation-wide metrics. Ensure that these data sources align to one or multiple parts of a business process. For example, say one priority is customer growth. The data source might include information around engagement or the customer journey.
Next, identify critical decision points – points where you choose to start, stop, continue or change aspects of your approach. Use your data sources to inform these points, explore and model potential outcomes, and measure the impact. For example, did efforts to optimise the customer journey result in higher website engagement and product trials? One data source can help you optimise many decision points before moving onto the next business process. This work sets you up for success before building out data assets that will be used across the entire organisation.

Monitoring market recovery at the world’s busiest airport
Dubai Airports uses data to drive decisions around key experiences and systems – from check-in queue times to flight arrivals and departures. This strategic approach allowed them to monitor market recovery, facilities reopening and passenger confidence related to COVID-19.
Read more[Analytics] helps us track evolving trends in the commercial aviation industry, enabling us to expand our network footprint and service offering.
Making it happen:
For executives using Tableau to drive strategic outcomes, understand the roles and responsibilities of the cross-functional project or “tiger” team dedicated to planning and managing your analytics deployment, defining Tableau governance processes, policies and more.
Chapter 3:
Grow value through targeted
use cases
Goal:
Create immediate value and engagement for priority use cases, sharing key data insights through dashboards and data visualisations.
What it looks like:
Create use cases aligned to priority areas to encourage interaction with data. These use cases take the form of data assets – visualisations, reports, dashboards and/or workbooks – that are useful, engaging and offer insights to help solve immediate business needs. Teams across the organisation can evolve these assets to suit their own needs and identify other areas that could benefit from additional data assets or data sources. As these assets evolve, ensure that teams refer back to the definitions outlined in leadership metrics, so everyone is speaking the same language. Share victories and patterns of success to help create a virtuous cycle that expands and deepens engagement across the organisation.

Generating organic excitement and trust at Red Hat
Red Hat’s Enterprise Data and Analytics team developed key performance dashboards, working closely with business leaders across all functional areas. This created synergy and trust that grew their data community and tripled their Tableau user base.
Read more
This sample sales pipeline dashboard shows how deals were affected by COVID-19. This example shows how you can adapt existing dashboards for different use cases.
People need to be able to formulate their own thoughts with data and to test their hypotheses in real time. Without that, it’s hard to actually solve business problems.
Making it happen:
Chapter 4:
Promote widespread
data discovery
Goal:
People at all levels have the confidence and the knowledge to follow the data discovery cycle on their own with as little intermediation as possible and then use data insights to drive business decisions.
What it looks like:
Once people are confident with data, they will want to ask richer questions and create new data assets for themselves. In practice, this means that data must be well-described, well-governed and accessible. It also requires widespread data literacy – the ability to explore, understand and communicate with data. At this stage, organisations benefit from data literacy training programmes to teach fundamental data skills. Fostering community programmes gives people a dedicated space to ask questions, share best practices and encourage engagement. At the beginning, these programmes don’t have to be large efforts. They can take place where conversations are already happening, and as engagement grows, you can formalise efforts with dedicated owners, leaders and processes.

JPMorgan Chase prioritises community and data literacy
To deepen engagement across a 30,000-person community, JPMorgan Chase used a gamified structure with skill belts that guide people through different levels of data training depending on their experience.
Watch nowMaking it happen:
Are you a Tableau enablement leader? Everyone encountering data at your organisation – regardless of their data literacy or analytics proficiency – needs to find insights and use them for decision making. Educate users, measure impact and establish best practices with Tableau Blueprint.
Conclusion
Future-proofing your organisation
for whatever comes next
Future-proofing your organisation for whatever comes next
Ongoing challenges and economic downturns are widening the gap between the leaders and the laggards: those who are actively embedding data and analytics into the fabric of their company culture and those who are hesitant to invest in the programmes and the technology that help them get there. Data-leading organisations pivot when necessary, innovate constantly and refine consistently, giving them a distinct competitive advantage in times of both stability and change.
Creating a data culture isn’t a matter of flipping a light switch. Now is the time to make incremental changes, starting with your workforce. Build out focus areas that lay the foundation for individuals and teams to expand their use of data. Taking these steps helps you move in the right direction, future-proofing your data culture for whatever lies ahead.
Meet the Tableau platform: Flexible technology that supports a scalable data culture
Tableau is the world’s leading analytics platform. Powerful, secure, and flexible, the Tableau platform is designed for the individual and scaled for the enterprise. As a trusted advisor to the world’s largest organisations – including Honeywell, Charles Schwab, Verizon, Nissan, Lufthansa and many more – Tableau helps customers successfully establish a culture of data built on trust and a strategic commitment to data.
Looking to accelerate your data culture? We wrote the blueprint.
Tableau Blueprint outlines Tableau best practices based on the expertise of thousands of customers to help you turn repeatable processes into core capabilities. It helps you see the big picture – your analytics strategy – or zoom in on a specific area to fine-tune and improve.
Tableau was the catalyst in helping employees have that ‘aha data moment’. That flicker of data cognition turning into deeper understanding was what Nissan needed for success in a digital world.

Additional resources
for data leaders
*Source: IDC whitepaper, sponsored by Tableau, How data culture fuels business value In data-driven organisations, doc. #US47605621, May 2021.