Why repeat Iron Viz participants keep coming back for more


No matter the stage of your data journey, there's always something new to learn, and the Iron Viz qualifier competitions offer the perfect opportunity. Maybe you want to try a different design style or chart type, experiment with storytelling approaches or try a new Tableau feature. Whatever the reason, you are guaranteed to gain new skills and inspiration throughout the process. For some, it can be scary to take the leap. For others, well, they keep coming back for more.
Several repeat Iron Viz qualifier entrants were among this year's top ten qualifier finalists. We reached out to Emily De Padua, Nathalie Richer, Ryan Soares, Maxwell Titsworth and Oana Tudorancea to find out more about their Tableau journey and what inspires them to continue to take the Iron Viz challenge.
What is your Tableau story? How did you get started with Tableau Public and get to where you are today?
Emily De Padua: I started using Tableau in December 2016 in my first data analytics role. My manager and now a very cherished mentor, Kyle Mathiot, tasked me with building a series of social media and web analytics dashboards. I knew very little about Tableau but was intrigued right away with its flexibility and all the ways we could use Tableau for executive reporting. I loved adding new features as my skills grew – this gave the dashboards a real organic, continuously improving approach. This is something that I cherish in my design approach to this day. I eventually created a Tableau Public profile where I finished my first community challenge, Makeover Monday, in January 2019. I entered my first Iron Viz in 2020 and placed 10th in the Qualifier.
Nathalie Richer: I started learning Tableau as part of a data visualisation course I was taking in 2018, and one of the assignments was to create a Tableau Public profile. A few months later, I posted my first Workout Wednesday, and I even started a Twitter account to share it. That’s when I discovered Makeover Monday and the incredibly supportive Tableau community. I quickly became addicted. My heavy contribution to some community and personal projects has helped me improve my skills and build a portfolio, bringing a radical change in my professional and personal path as I have started working as a freelance Tableau consultant.
Ryan Soares: I started using Tableau Public in 2018, mainly sharing vizzes for Makeover Monday. At the time, I was getting more practice with data visualisation, and publicly sharing my work helped me get feedback from the community. Eventually, I started to make vizzes for fun and as a hobby which helped build my portfolio and experiment with different designs. I entered Iron Viz because it was another opportunity to learn and develop my skills.
Maxwell Titsworth: I had worked as a data analyst/scientist for some time and needed to build a map. I was on a short time frame, so I downloaded Tableau and built a beautiful map within five minutes. I was immediately hooked. After shifting to a role focused more on Tableau, I was inspired by my colleague Nicole Varela to really lean in on human-centred design and create a Tableau Public profile. I've published to Tableau Public ever since.
Oana Tudorancea: I first learned about Tableau during a higher education conference in 2016. My mind was blown at the possibilities. Later that year, my office purchased the software. It brought my work up to another level and strengthened relationships with our stakeholders. While I checked Tableau Public almost daily for inspiration and ideas, I felt intimidated to get started, but I finally did it in April 2021. The Atlanta Tableau User Group held an Iron Viz Atlanta, and I created my account to publish the viz for that competition. That was a lot of fun, and I learned more than I expected, so it motivated me to keep going.
What about Tableau’s Iron Viz made you want to re-enter?
Emily De Padua: I love the spirit of Iron Viz, where everyone is collectively working on their entry. There’s something really beautiful about how the Tableau community comes together to cheer everyone on like marathon runners to make it to the finish line. Both years I entered, I truly believed in the ideas I had. I was passionate about it. They were vizzes I would have wanted to make. Iron Viz gave me the pressure cooker environment I needed to focus on and bring them to life. I think when you re-enter, there can be an internal pressure to be greater than your last performance. But something I really appreciated about re-entering after taking a year off was that it wasn’t about the prize or the prestige. It was about making it to the finish line.
Nathalie Richer: Since I started my Tableau Public profile, I have participated in three Iron Viz feeders. Last year, I did not participate, and I missed it. Like Sarah Bartlett said, "There's always a real buzz around Iron Viz season. While it's fun to watch from the sidelines, it's even better to take part." Entering the Iron Viz feeder guarantees that I will experiment and challenge myself with a larger piece of visualisation than usual. For example, my longest and now largest viz are Iron Viz entries.
Ryan Soares: I submitted in last year's Iron Viz for the first time and made the top ten, so I wanted to try and improve on that. Generally, I find Iron Viz fun to participate in because the themes are interesting, and it's a great opportunity to learn.
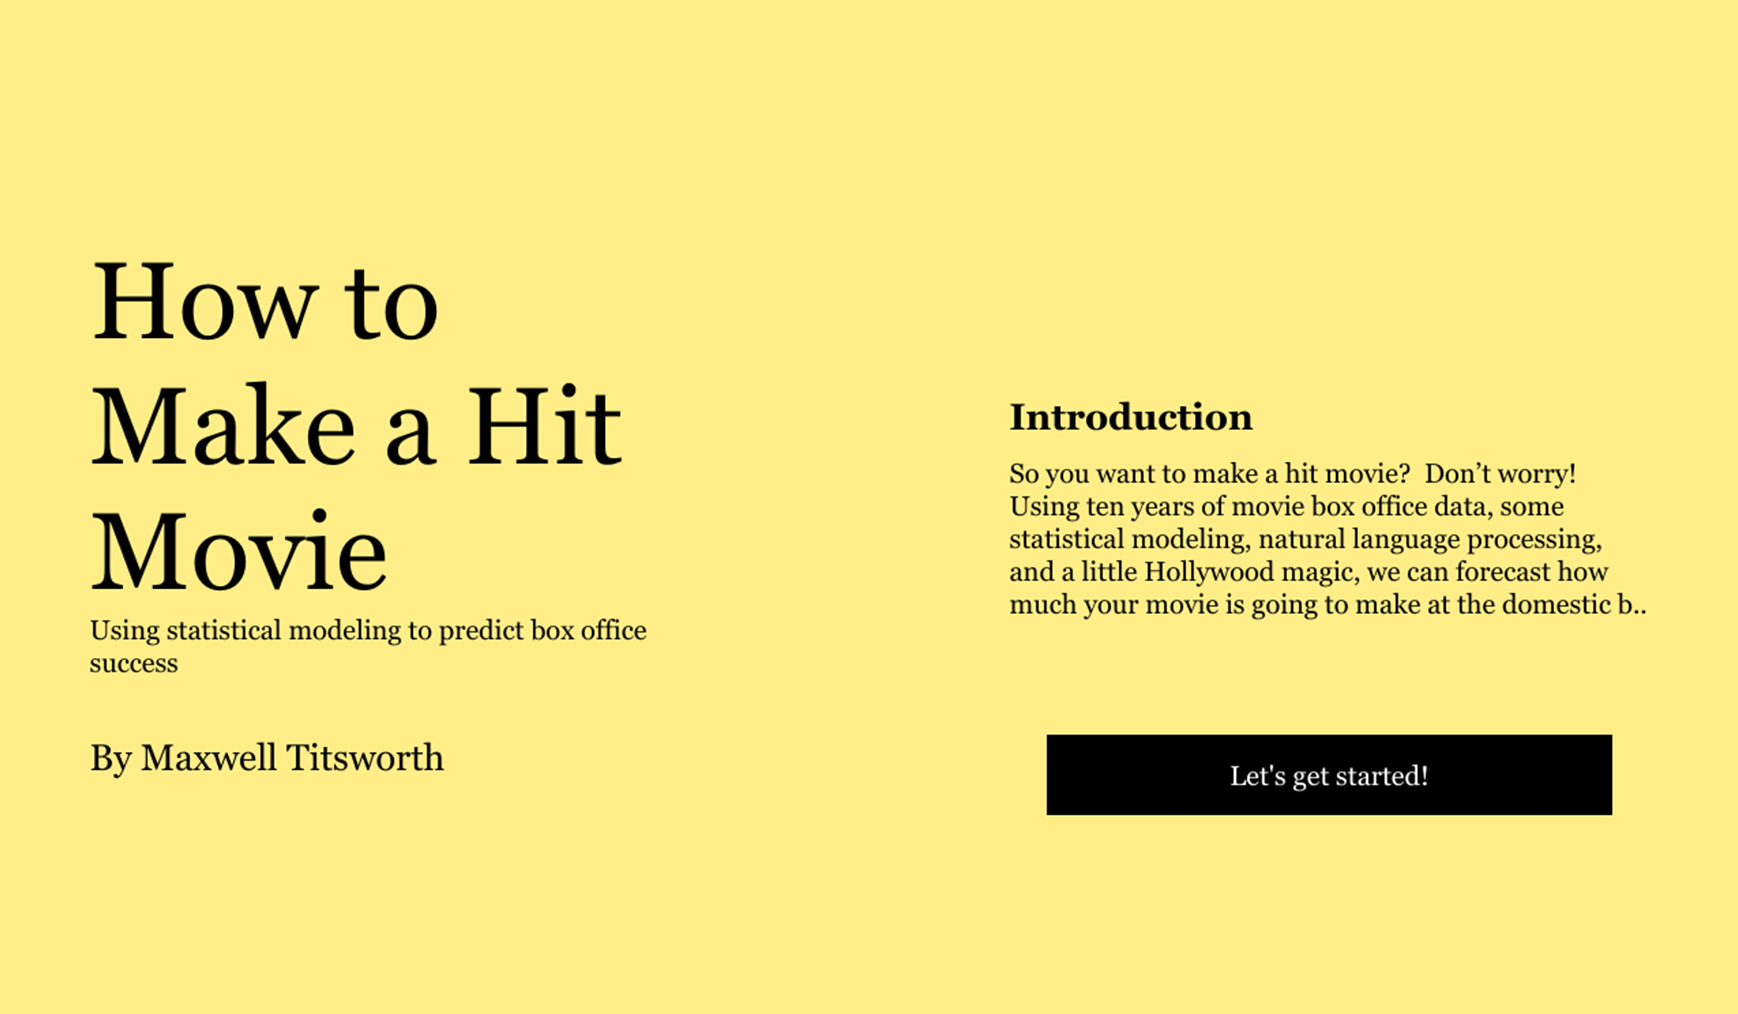
Maxwell Titsworth: The open-ended challenge to visualise the arts gave me wide latitude to explore some ideas. I had some ideas I had been stewing on, including the film financial analysis, that felt like a good fit. I was also inspired by my colleague Briana Dalce and her 2022 goal of regularly publishing to Tableau Public, so I figured I would hop on that and try to push myself in 2022. Lastly, I wanted to experiment with how we can visualise outputs from statistical/machine learning models in Tableau.
Oana Tudorancea: Both times, I entered the competition as a learning experience and as a way to connect with the community. Last year my goal was to enhance my design skills, and Iron Viz provided a great opportunity for that. So I decided to continue to enter every year. I also love the feeling of anticipation when Tableau announces the qualifier theme – deciding on a topic, the community coming together, sharing feedback and encouraging each other – it’s an all-around positive experience.
What advantages does having entered before have? What came easier this time around?
Emily De Padua: Having entered before, I knew how to budget my time. My biggest personal gain from entering Iron Viz 2020 was learning so much about myself, my vizzing style and how I like to work. I knew what worked for me – an iterative design approach, interactive, and a topic I’m passionately and emotionally connected to. I knew what hours I loved to viz – weeknights only, usually after 7 or 8 pm until my brain was tired around 2 am, and no weekend builds until that big “approaching the deadline” final push. I knew to get feedback as soon as I got stuck, and that I would make it to the finish line.
Nathalie Richer: The advantage was my knowledge of what would be time-consuming, like learning and creating complex charts and choosing images, colours, icons and fonts that align with the theme. My first Iron viz entry was very colourful, “iconful”, “fontful” and was more about applying almost everything I knew and learning new charts along the way. For example, I learned how to create a sunburst chart adapted as an orchestra stage to match the music theme with the help of a sunburst template from the Flerlage Twins.
Ryan Soares: I understood myself better in terms of what I had to do to make a quality submission in a limited amount of time. The first time, I was kind of disorganised and had to rush during the final week to put something together. This time, I tried to budget my time better, which helped me stay on track and gave me more time to focus on the story and analysis.
Maxwell Titsworth: This time around, I understood the timeline and work required for a polished submission. I generally knew what an appropriate pace of work was to prevent last-minute development.
Oana Tudorancea: After last year’s competition, I watched different sessions with previous winners where they talked about their experiences and gave advice. I also read Notes from an Iron Viz Judge by Karen Hinson to better understand how the judges approach the process. It really helped my approach and what I concentrated on. I also had a better sense of the timeline, so I knew how to prepare.
Let’s talk about growth. What did you notice about your visualisation skills that may have improved since the last time you entered?
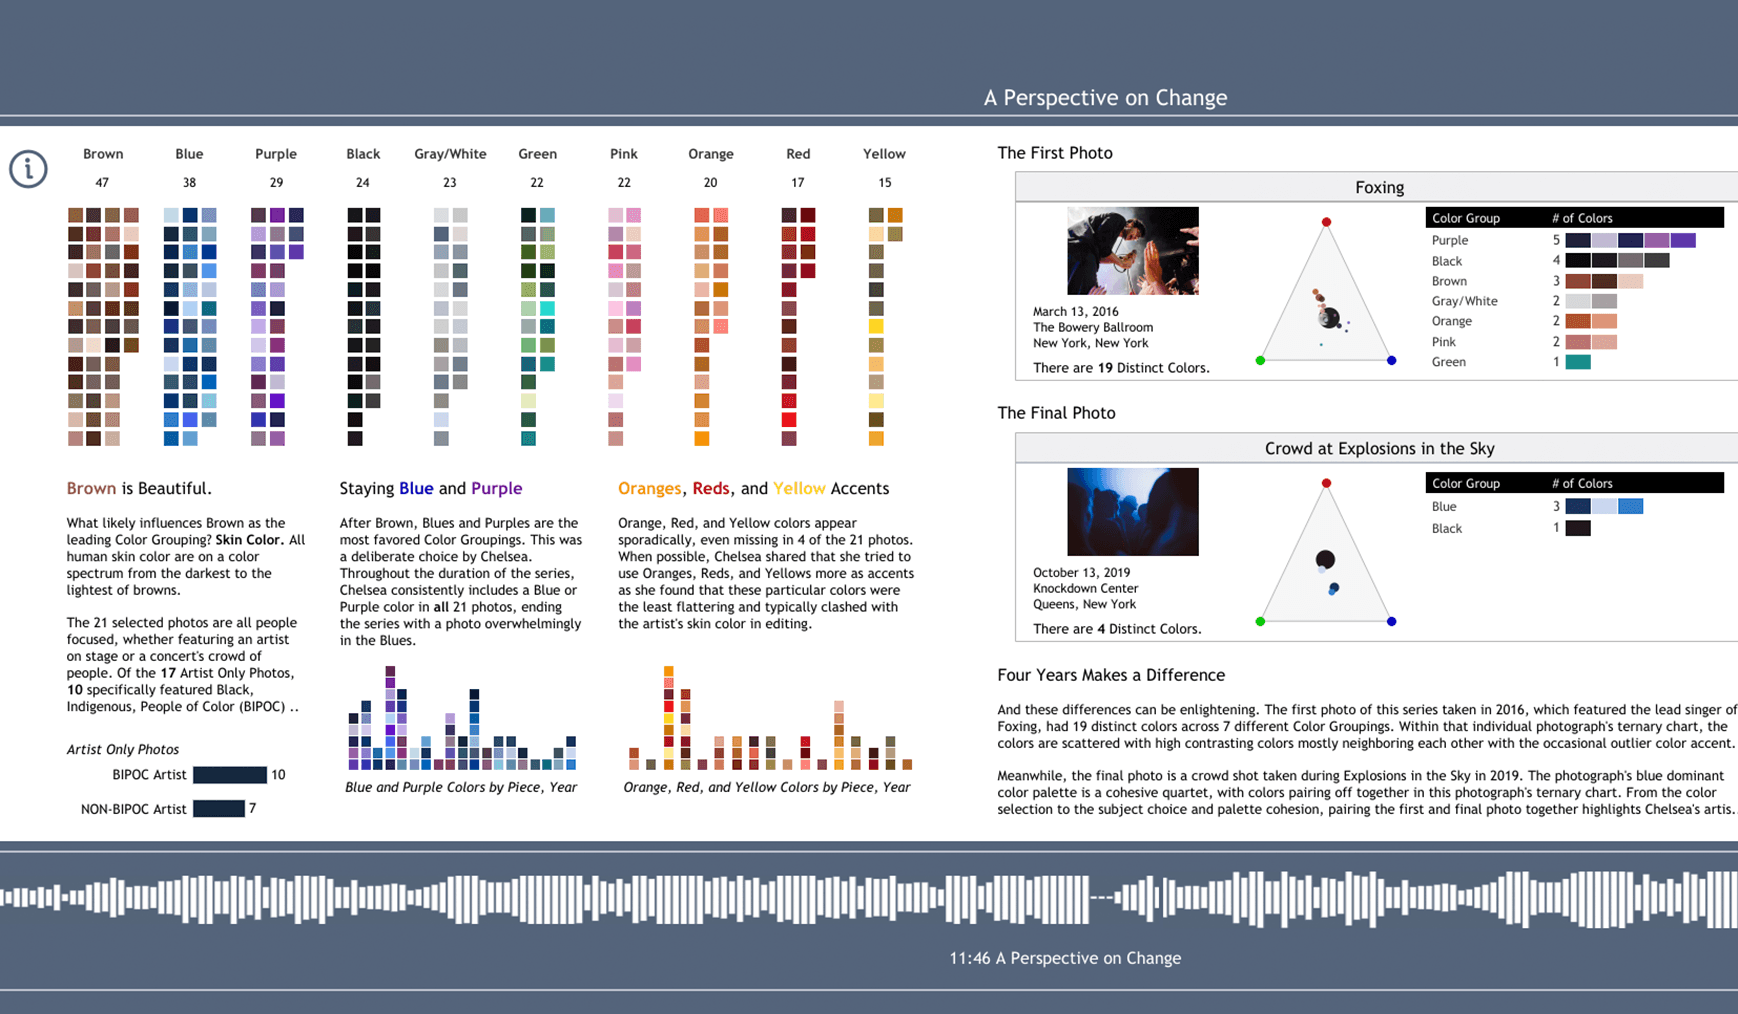
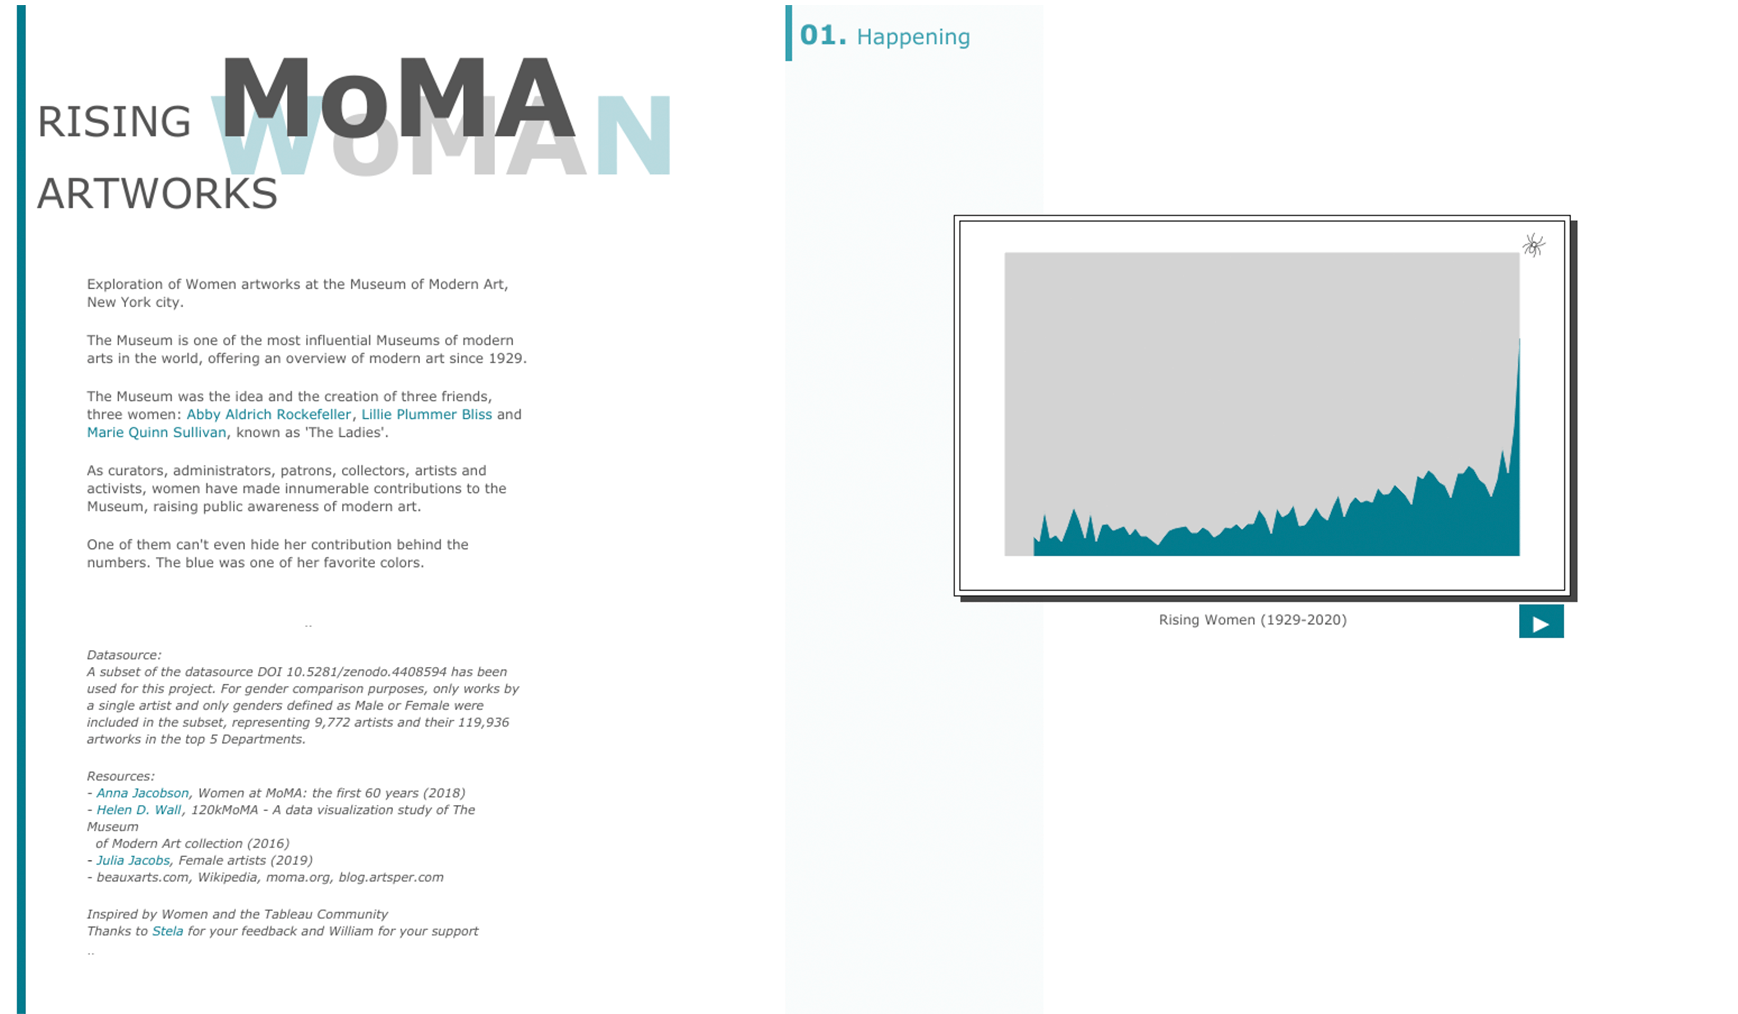
Emily De Padua: When I placed 10th in 2020, I noticed that I had one of the lowest storytelling scores. And looking back, I understand. My storytelling meandered and was in the interactions. I designed All By Myself? as an almost scavenger hunt challenging audiences to find as many hidden Easter egg details about my life. I didn't feel confident or comfortable committing to a specific narrative. I think it was because I was still uncertain about my own conclusions about that very specific and isolated period of my life. In a lot of ways, I was still finding my voice. And that is what is so rewarding about the growth demonstrated in Color Studies. I wholeheartedly committed to my storytelling style. I innovated on accessibility and embraced my voice – in text, design choices and sound. I pushed myself to really put myself out there. The growth of my storytelling from 2020 to 2022 is something I am just so proud of.
Nathalie Richer: My skills have improved on the user experience side. For my previous entry, the message was clear only to me. Now I am more focused on creating a user journey, especially with long-form visualisations, guiding the user through simple exploration with an on-demand context and a design that gives more clarity and shows their attention while communicating the message. I think of data-driven storytelling as a Gaussian profile, helping the user immerse slowly in the subject while leading them to understand the most intense and complex message later on the curve, then decreasing gradually in intensity to the final point.
Ryan Soares: I felt that my analysis and ability to find more interesting insights improved. I gave myself more time to dig into the dataset and do some background research which helped piece together the insights presented in my viz.
Maxwell Titsworth: Strangely, I've become more interested in going simple. Well-designed bar charts can achieve so much. I also wanted to experiment with some design minimalism and be more thoughtful about my choices.
Oana Tudorancea: I have improved my design and storytelling skills. Putting together a submission for Iron Viz teaches you way more than you expect. This happens both while you work on your viz and after submission when you have time to step away from it and reflect on your decisions.
What advice would you give people considering entering Iron Viz next year?
Emily De Padua: Sometimes, especially as data analysts with stakeholders, we can get trapped working so hard on what other people want that we can lose sight of what we, as the creator, personally want. Entering Iron Viz was a reclaiming of an artistic voice, and a design perspective that I didn’t even realise was mine to lose. Ultimately, by entering Iron Viz, you learn so much about yourself – the way you think, design, connect, etc. I hope you embrace that growth and change.
Nathalie Richer: My advice would be to read the Reasons to enter Iron Viz from Sarah Bartlett. I highly recommend participating in an Iron Viz feeder because it gives you the ability to experiment and accelerate your learning curve while creating unique and amazing content that you’ll be very proud of. When available, ask if you can get your score from the judges. Those metrics will let you know or confirm your strength and evolution on the three criteria: analysis, design and storytelling.
Ryan Soares: There's nothing to lose by entering Iron Viz. If you have the time to set aside for building a viz, entering the competition will be beneficial regardless of your skill level. Don’t be intimidated by the winning visualisations or let that hold you back from entering; instead, use it as inspiration and treat the competition as a learning experience to develop your skills and have fun.
Maxwell Titsworth: The Iron Viz period is much shorter than you expect. Set a schedule and identify key dates where you need to move on to the next phase (data identification > wireframing > prototype development > polish). Work with colleagues/members of the Tableau Community to keep pace and get feedback.
Oana Tudorancea: I advise anyone to join a feedback session early in the process. It’s such a positive experience while you are working on your submission. You have the opportunity to be a part of the amazing collective energy of the feedback group. I have found it highly motivating and encouraging.
How has the community helped your data journey? Did you participate in #IronQuest or seek feedback from the Tableau Community? How did that help you?
Emily De Padua: The camaraderie and community feedback are the true gift of Iron Viz. I wouldn’t have made it to the finish line without the kindness of others’ brains. ‘All By Myself?’ had a village of people cheering me on, and ‘Color Studies’ was no different. In 2022, I was so intentional with getting feedback as quickly as possible, through the Iron Viz Feedback Initiative run by Sarah Bartlett or by reaching out to trusted Tableau Community members that I deeply admired. In both years I entered, I have had moments of self-sabotage where I almost talked myself out of entering. The community was what kept me going.
Nathalie Richer: The community has helped me a lot throughout my data journey, especially participating in the Makeover Monday and Workout Wednesday projects, and it is still helping me to date. The Tableau Community is a real support for keeping me updated on the many new features released in each new version of Tableau. My go-to is the Tableau Tim channel, where Tim Ngwena comes to the rescue with great video content to fill the gap. Overall, the community is incredibly prolific in producing content to help others with different resources like TUGs, tutorials and templates.
Ryan Soares: The community has been very important in my data journey. Without community initiatives like Makeover Monday and Sports Viz Sunday, I likely wouldn't have improved and built my portfolio to what it is today. I always see inspiring work that I can learn from, and the community is always open to giving feedback. These have all been essential parts of developing my Tableau and viz skills.
Maxwell Titsworth: The community was essential. Sometimes, it’s not direct, but seeing how people have approached other visualisation problems in the past was incredibly helpful. I have also built a network of friends and colleagues interested in visualization to whom I regularly showed my dashboard. The community has also produced a wealth of resources for producing advanced visualisation like Sankeys and other cool charts that tend to be common in Iron Viz.
Oana Tudorancea: I learned everything – and continue to learn – from and with the help of the Tableau community. None of it could have happened without the ecosystem of resources contributed by the community. Participating in Sarah Bartlett’s feedback initiative was a game-changer for me. Receiving feedback and encouragement from some of the best helped me push through those last few days before the deadline. I also want to give a shout-out to the Flerlage Twins, Kevin and Ken for sharing their knowledge with the community. I often go to their blog for work and non-work-related Tableau projects.
What was the scariest part about participating? What was the most fun? Looking back, is there anything you would do differently?
Emily De Padua: The fun thing about entering was that your viz could become a way to connect to people. In all honesty, as much as I admit to being a top-tier nit-picker, there really isn’t anything I would do differently. The special thing about the Iron Viz window and your entry is that it really does become a time capsule of who you are (in whatever capacity) for that period. I made choices back then that I maybe wouldn’t make now because I have grown. And this growth is something I will always celebrate.
Nathalie Richer: The fun part always appears during my process: I feel like I am in a labyrinth, with lots of pieces of information, research and validation, and then suddenly, it clicks. Everything becomes clear and easy to bring together. I would do nothing differently. I had an excellent experience, and I am grateful and happy about the result. Next time I might want to get feedback from the Tableau Community, especially from the Iron Viz feedback initiative or the #VizOfficeHours led by Michelle Frayman and Zak Geis.
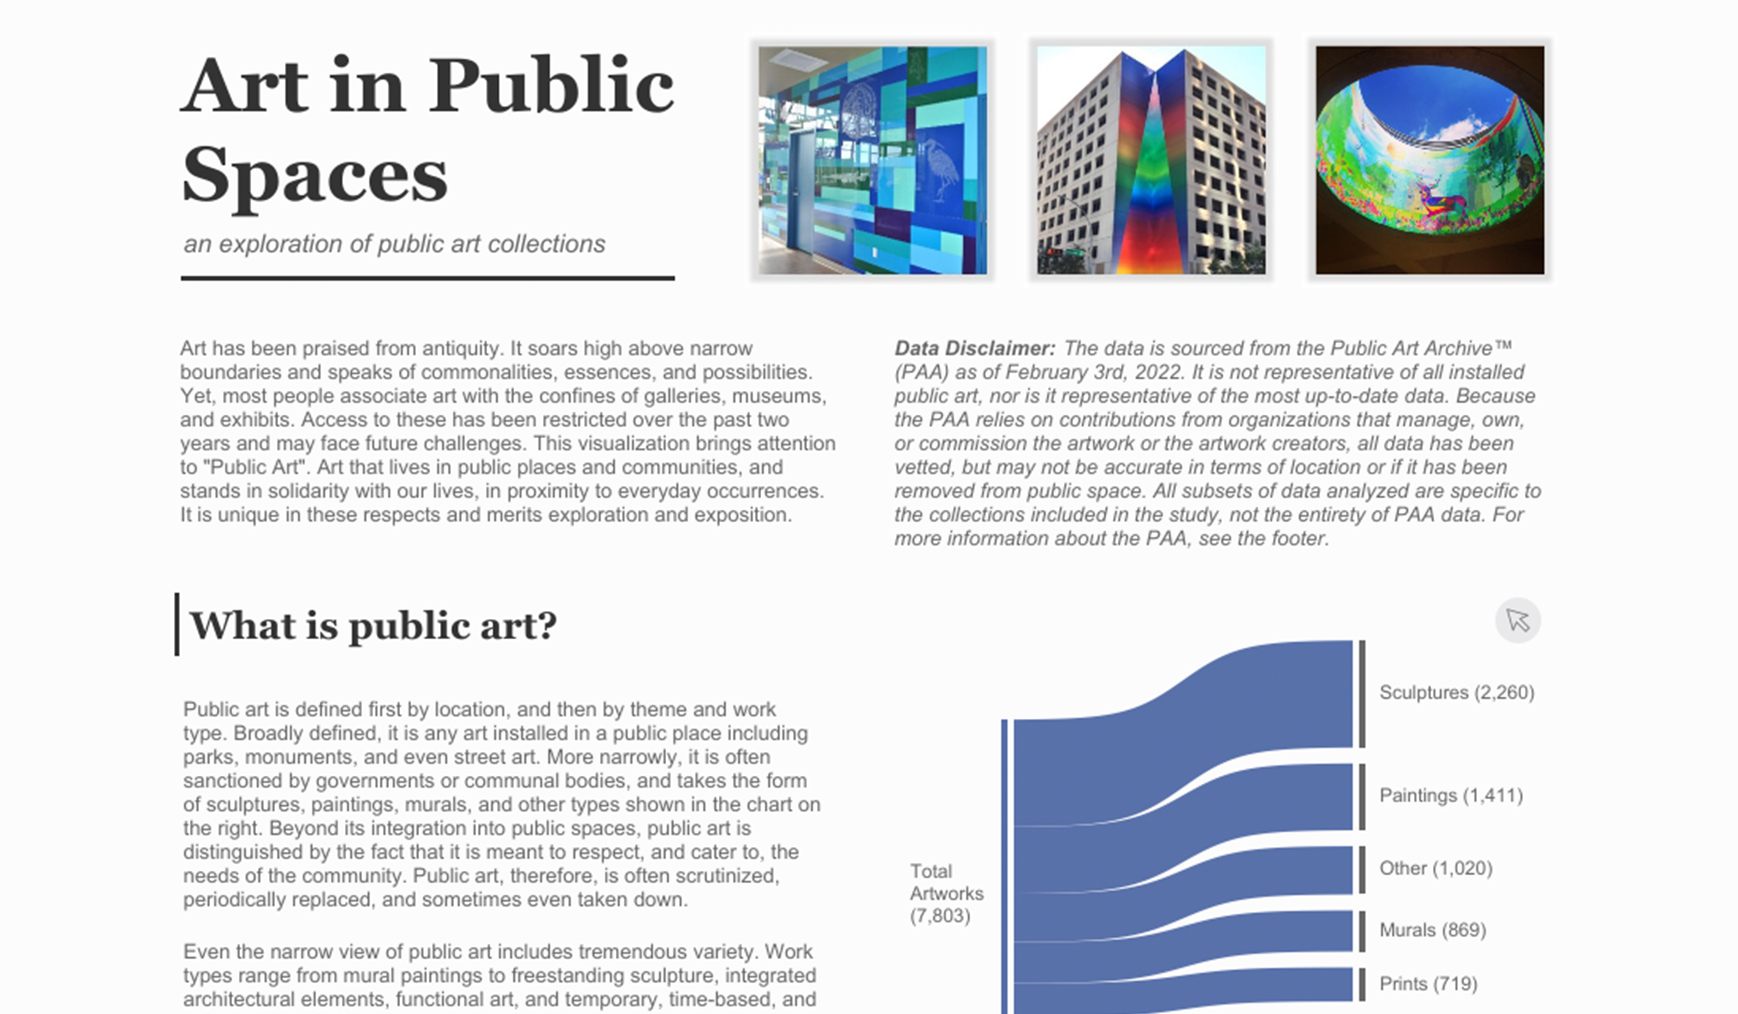
Ryan Soares: I think one of the best things about Iron Viz is that you learn about and explore a topic that you may not have outside of the competition. My viz was on public art displays, so it was very interesting to explore the different types of art, the process behind creating public art, and the artists that make them.
Maxwell Titsworth: It requires you to put yourself out there and be humble enough to receive feedback/critique. All of this is important for professional and personal growth. The thing I enjoyed most was seeing the community come together and support each other through what can be a relatively intense period of development. Next time, I intend to engage more directly throughout the process on platforms like Twitter to lend my support to others trying Iron Viz for the first time.
Oana Tudorancea: I wouldn’t say it was scary, but a bit intimidating to know that whatever I build will be shared with such a wide audience. However, stepping out of your comfort zone has a lot of benefits. I also had a lot of fun researching my topic and checking Twitter regularly to see who submitted what. Looking back, I think what I would do differently would be to participate in the feedback initiative earlier in the process. I’ve learned that giving myself more time for revisions is part of a good strategy.
Get a front-row seat to the May finals
We appreciate these five go-getters for sharing some of their experiences and inspiration with us. They did a fantastic job, and we can't wait to see what they come up with next. If you're like us, you are counting the days to see who will reign supreme in the final showdown. Make sure to register for Tableau Conference 2022 – live or in-person – to watch the Iron Viz Championship.
Related stories
Meet Iron Viz 2024 Finalist Chris Westlake
 22 April, 2024

Meet Iron Viz 2024 Finalist Jessica Moon
15 April, 2024

Meet Iron Viz 2024 Finalist Pata Gogová
8 April, 2024
Subscribe to our blog
Get the latest Tableau updates in your inbox.