Behind the Viz: Adedamola (Damola) Ladipo shares his favorite Tableau trick


Get to know your fellow Tableau Public authors with Behind the Viz, a blog series where we explore the people and processes behind our featured vizzes.
Today we’re honoring the work of Adedamola (Damola) Ladipo! Damola is a Data Visualization Specialist for the U.S. Agency for International Development Data Services at DevTech Systems, Inc. who grew up in the United Kingdom and the United States and has worked in the Washington DC area, Central Asia, Sub-Saharan Africa, and the Middle East. His academic background is in International Development Monitoring and Evaluation and Data Visualization.
Read on to learn how Damola first got involved with the Tableau Community and explore his viz, Must Read Books by Black Authors.
He started using Tableau Public in December 2020 to engage with the DataFam and has shared data visualizations for #MakeoverMonday, #DiversityinData, and personal projects on topics including food apartheid, must-read books by black authors, and how mixed the martial arts is in the UFC. His interests more broadly include climate change, social issues, economics, sports, and conflict. His favorite part about Tableau Public is learning from others and sharing his work on informative topics.
Why did you choose this topic?
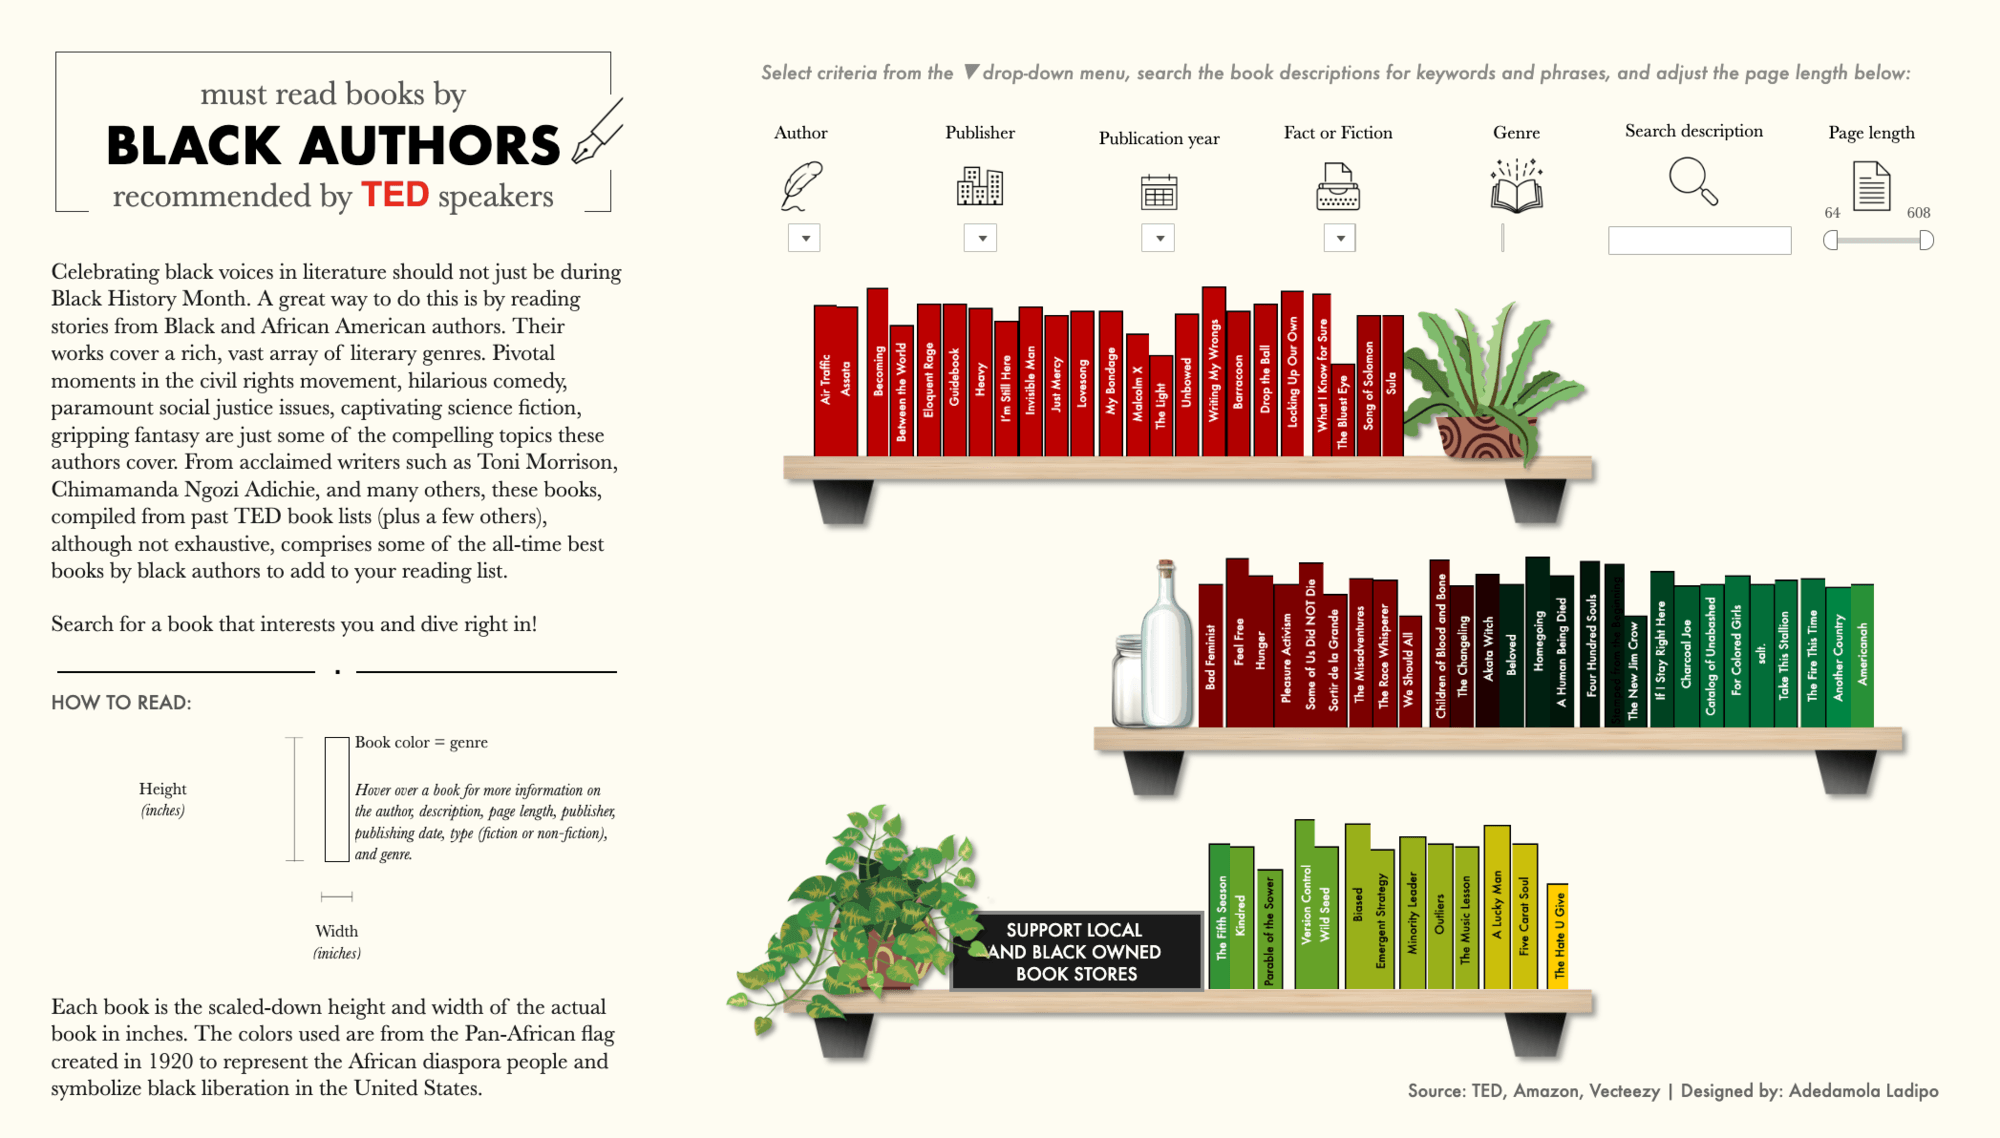
I wanted to create an interactive visualization to celebrate Black voices in literature. I also wanted to create a tool that users could use to find books they would be interested in reading that were written by Black authors.
What was the hardest decision you made when creating this viz?
The hardest decision when I made this viz was deciding which books to include. Picking some of the best books by Black authors can have some bias and could get too long. So, to make a less partial list based on my personal preference and make the number of books more reasonable, I decided to use the 62 Great Books by Black Authors. This is a curated list compiled from previous TED book lists. I did add a couple extra that I thought were noteworthy, so there may have been some bias.
Did you run into any design challenges during this process?
I went back-and-forth on deciding to use the actual width of each book as the relative width in viz or to use the book's rating for the width. I decided against using the rating for the width to avoid bias from a specific source. The purpose of the viz was to celebrate Black voices in literature, so showing critics' book ratings was not part of the purpose of the viz. Besides, readers can always look into details like that on their own anyway.
What is your favorite new Tableau trick? How can others use it?
This may not be new to some Tableau users, but the Data Pivot function in Tableau is an excellent trick, and you do not need Tableau Prep to do it.
Sometimes you may have a dataset that is "wide," and you need it to be "long." For example, let's say you have data on the make and model of some cars and their prices at the manufacturer's suggested retail price per year. However, the prices for each type of vehicle per year are in separate columns - making the data wide.
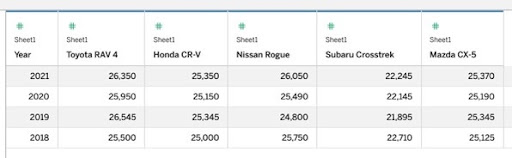
You can pivot the data so the cars make and model are in one combined column and the prices are in another column to make the data format long.
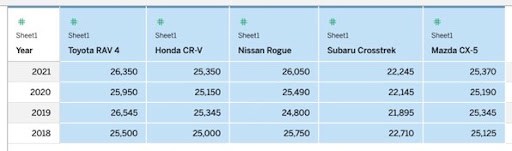
Here is how it can be done:
- Right click on one of the columns headers then select Pivot
- The data will now be pivoted with two new pivot columns (Pivoted Field Names and Pivoted Field Values)
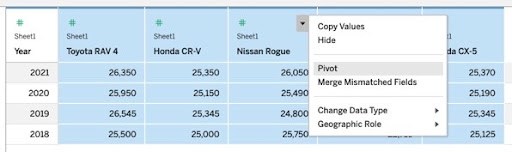
- Rename the pivoted columns as needed to complete your new pivoted dataset
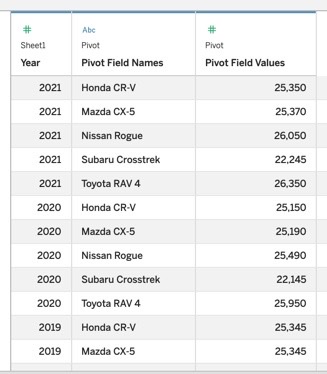
Now you have a long dataset!
What does the DataFam mean to you?
The DataFam to me, is a community to learn, collaborate, share questions, thoughts, and ideas, and most of all, be inspired by others in data visualization and related and complementary fields.
If members of the DataFam visit Washington, D.C., what would you recommend they do or see?
I suggest members of the DataFam community go to the museums and galleries in Washington DC because almost all are free! I would especially recommend they visit the National Museum of African American History and Culture. The museum's exhibits are vast, impressive, and informative. There is a lot to explore in the National Museum of African American History and Culture, and it's worth going to more than once to have time to see it all.
What is the best music to listen to while vizzing?
I often listen to music by Kaytranada when I'm working on a viz. His music is best described as a mix of electronic, hip hop, R&B, dance, funk, and house. If I'm not listening to one of his albums or DJ sets, I'm likely listening to a synthwave/retrowave/chillwave mix.


If there's a particular viz you'd love to know more about, consider nominating it for a Behind the Viz blog post by contacting us at public@tableau.com.
Related stories

Meet Iron Viz 2024 Finalist Jessica Moon
 15 April, 2024

Meet Iron Viz 2024 Finalist Pata Gogová
8 April, 2024

Student to BI Analyst, How Tableau Can Lead to a Successful Data Career
 20 March, 2024
Subscribe to our blog
Get the latest Tableau updates in your inbox.