Cut Your Data-Flab for Faster-Loading Vizzes


Note: This post is based on this post on the Tableau blog.
It’s all about the speed! Hate that spinning grey wheel of doom as your viz loads? Afraid of losing your audience if your vizzes response or load time climbs into the multiple seconds? Follow these tips to cut your viz's data-flab, and let you viz load at speed.

Waiting for a viz to load; the spinning wheel of doom.
1. Mind the Data Structure and Size
Data-flab: A condition in which your data set is carrying extra data-weight that slows your analysis down. The more data that you have, and the extra process power required for clunky joins or blends, can cause your viz to load really slowly.
To reduce data-flab, follow these tips.
Only Use the Data You Need
 Often we connect to much more data than we need. It’s not uncommon to only be looking two out of the twenty measures in your data set. These extra fields can slow your loading speed down.
Since an extract is a columnar store, the wider the data set, the slower the query time.
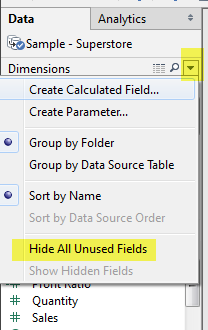
- Minimize the number of fields based on the analysis being performed. Use the hide all unused fields option to remove unused columns from a data source.
- Minimize the number of records. Use data source filters to keep only the data you need.
Be Smart with Tableau Joining and Blending
Joins and blends require more processing power, and as such, more time to execute. Have you tried to make a custom map by joining your data set to a large geo-reference file and found that it can literally take minutes to load? Being smarter with your joins and taking advantage of Tableau’s query optimisation can help.
- Blend on low-granularity dimensions. The more members in a blend, the longer it takes. Blending aggregates the data to the level of the relationship. Blends are not meant to replace row-level joins.
- Use row-level joins instead of blending where possible. Using left or inner joins means that you only use the data you need.
- Minimize joining too many tables together. Lots of joins take lots of time. If you find yourself creating a data set by joining many tables (for example, more than three tables), it may be faster to consolidate all the tables into one new table first.
- Remove custom SQL. Tableau can take advantage of database optimizations when the data connection does not use custom SQL. One such example of how you can reduce the need for custom SQL is utilising Tableau’s pivot function to make arc maps.
2. Limit Your Filters by Number and Type
Does your dashboard have 12 quick filters on it? Do you really need all of them? (Hint: You probably don’t.)
Filtering in Tableau is extremely powerful and expressive. However, inefficient and excessive filters are one of the most common causes of poorly-performing workbooks and dashboards. Note: Showing the filter dialog requires Tableau to load its members and may create extra queries, especially if the filtered dimension is not in the view.
- Reduce the number of filters in use. Excessive filters on a view will create a more complex query, which takes longer to return results. Double-check your filters and remove any that aren’t necessary.
- Use an include filter. Exclude filters load the entire domain of a dimension, while include filters do not. An include filter runs much faster than an exclude filter, especially for dimensions with many members.
- Use a continuous date filter. Continuous date filters (relative and range-of-date filters) can take advantage of the indexing properties in your database and are faster than discrete date filters.
- Use Boolean or numeric filters. Computers process integers and Booleans (t/f) much faster than strings.
- Use parameters and action filters. These reduce the query load (and work across data sources).
3. Reduce The Number of Marks (Data Points) in Your View
When data is highly granular, Tableau must render and precisely place each element. Each mark represents a batch that Tableau must parse. More marks create more batches; drawing 1,000 points on a graph is more difficult than drawing three bars in a chart. A common example of this is a filled map. In filled maps, Tableau draws thousands of points to make the outlines of each country.
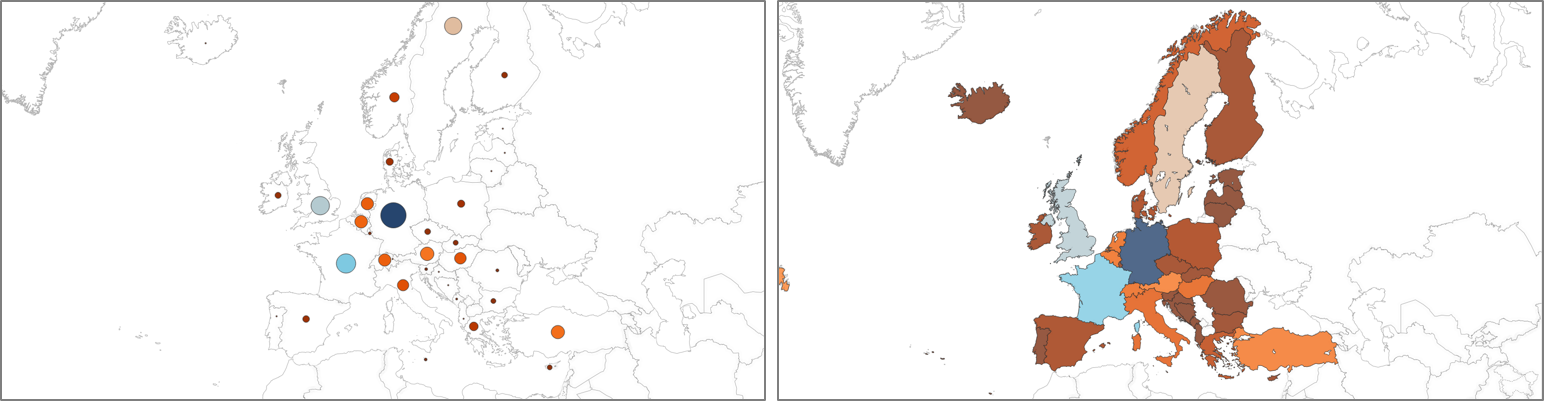
The dot map will load much faster than the filled map.
Additionally, having lots of data points can make your visualization harder to understand by presenting too much information at once.
Here’s how you can avoid this trap:
- Practice guided analytics. There’s no need to fit everything you plan to show in a single view. Compile related views and connect them with action filters to travel from overview to highly-granular views at the speed of thought.
- Remove unneeded dimensions from the detail shelf.
- Explore. Try displaying your data in different types of views. A great example of this is using a dot map instead of a filled map, or showing an aggregated bar chart rather than all the individual data points.
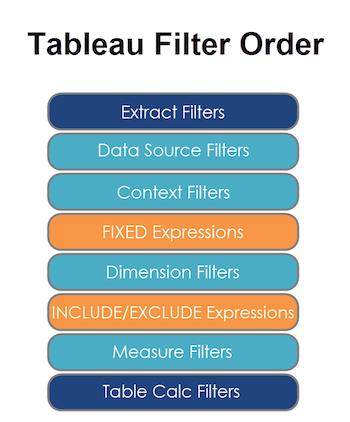
4. Optimise and Materialise Your Calculations
- Reduce the number of nested calculations. Just like Russian nesting dolls, unpacking a calculation and then building it takes longer for each extra layer.
- Reduce the granularity of LOD Expressions or table calculations in the view. The more granular the calculation, the longer it takes.
- LODs - Look at the number of unique dimension members in the calculation.
- Table Calculations - The more marks in the view, the longer it will take to calculate.
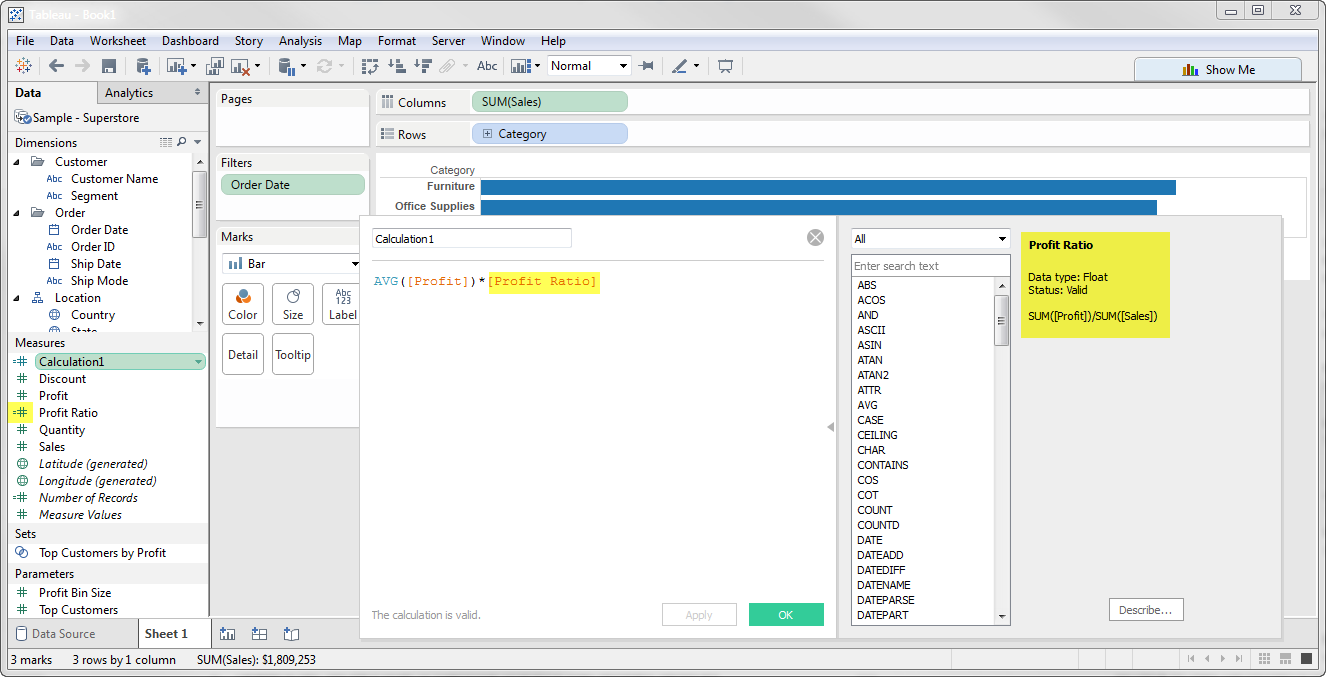
- Where possible, use MIN or MAX instead of AVG. AVG requires more processing than MIN or MAX. Often rows will be duplicated and display the same result with MIN, MAX, or AVG.
- Make groups with calculations. Like include filters, calculated groups load only named members of the domain whereas Tableau’s group function loads the entire domain.
- Use Booleans or numeric calculations instead of string calculations. Computers can process integers and Booleans (t/f) much faster than strings. Boolean>Int>Float>Date>DateTime>String
5. Clean Up Your Workbooks!
A clean workbook is a happy workbook.
- Reduce dashboard scope. Excess worksheets on a dashboard can impact performance. Also this is good practice to help you design better for small screens.
- Delete or consolidate unused worksheets and data sources. Have worksheets that you aren’t using in your final dashboard? Delete them. A smaller workbook will load faster and also work better if your audience’s internet connection is running slow.
Related stories

Meet Iron Viz 2024 Finalist Jessica Moon
 15 April, 2024

Meet Iron Viz 2024 Finalist Pata Gogová
8 April, 2024

Student to BI Analyst, How Tableau Can Lead to a Successful Data Career
 20 March, 2024
Subscribe to our blog
Get the latest Tableau updates in your inbox.