How Porsche and HeidelbergCement use data to create transparency


Increased transparency is improving business operations, positively impacting the bottom line and enabling manufacturing businesses to become more environmentally sustainable. Luxury automotive firm Porsche and one of the largest global suppliers of concrete to the construction sector have delivered improvements to their business processes as a result of better use of data and data visualisation.
“We had a high amount of information about activities, but a very low level of transparency,” says Karsten Lippel, of the Porsche Corporate Quality division at the Stuttgart headquartered and world-famous car maker. Lippel adds that poor transparency led to a lack of understanding around rectifying process problems once identified, including timelines for when a fix had to be in place and who was responsible.
As a prestigious car brand, Porsche regularly carries out process audits, with Lippel’s team acting as neutral observers. The process audits remove barriers and connect divisions of the organisation to eradicate process and quality issues within the company. “We do this by monitoring processes and interviewing both parties, as we want to know what goes on in the process and what resources are used. We then define the risks and identify the improvements,” he says. Part of the analysis process includes collecting documentation and data created by various parts of the organisation. “We wanted to be able to visualise trends and to give some insight,” Lippel says of the importance of analytics. He adds that this shows divisions of the business where overlaps and issues exist.

Part of the analysis process includes collecting documentation and data created by various parts of the organisation.
Ian Horn at HeidelbergCement is on a similar trajectory to Lippel, using data and visualisation to help 17 global plants identify weaknesses in their organisations and rectify them. “We prepare a targeted analysis that is strategic, as each report answers a management question,” Horn of the HeidelbergCement Competency Centre says. Serving a global business, Horn says the visual reports provide information a business unit can use “now”.
“Each report is a one-pager. We want the user to identify an issue in minutes; they are not expected to drill down and find something. We try and tell a story with our information,” he says. As a result, the reports are written in a way to deliver transparency to the business lines so that they can easily make decisions. “We don’t want to say ‘fix this’. Rather we say if you fix this, it is worth this amount of information to your business,” he says of presenting the information in values that create transparency.

Reports are written in a way to deliver transparency to the business lines so that they can easily make decisions.
Each of these organisations and their data strategies are driving improvements to the manufacturing and business processes through the collation, transformation and presentation of data. At Porsche, Lippel found he had a wealth of information from different areas of the factory or product lines, but discovered there was no real tracking of these reports and, therefore, no sharing and collaboration. As a result, the organisation is unable to learn. Horn agrees and says developing business reports was a way for the German business to “reimagine business performance”.
“Our whole role is to assist Heidelberg ReadyMix in each country. Initially, we couldn’t do that without information that is collated and disseminated in a way that business units could use clearly.” This led to the Automated Concrete Data Collection (ACDC) programme. Now Heidelberg can see, via dashboards, the capacity of its cement making plants, moisture in the cement mixtures and the strength of the concrete material made, amongst many other data insights.
Connecting data
Both projects required their data leaders to undertake a programme of data management to create the right data sets to deliver reports that increased transparency. “The data comes from our IT systems, but we also needed to get the structure right,” Lippel at Porsche says, describing the challenges of connecting manufacturing systems and a number of different data resources together. Horn faced a similar challenge as he extracted data from the SAP Hana enterprise resource planning (ERP) platform. In addition, Horn discovered: “What we are finding is that each country has different levels of sophistication, some are really strong on process and data, others are reliant on Excel.”
We are now using Tableau to show outcomes and measure deficiencies. This information is consumed from the planning right up to the board level.
Lippel at Porsche used the collapsing dashboards functionality within Tableau, which he says transforms the large levels of information into convenient modes of access for users. “We are now using Tableau to show outcomes and measure deficiencies. This information is consumed from the planning right up to the board level,” he says, describing how a transparent view of errors and issues across the manufacturing process is shared across the business.
Lippel at Porsche and Horn at Heidelberg have created the fabled single view of the truth. If an organisation is to tackle issues with its products or obstacles in the manufacturing process, the very first challenge to be dealt with is the truth. With one set of data that is always accessible to all stakeholders in the organisation, Porsche and HeidelbergCement are able to move towards resolving issues in manufacturing processes much faster and with increased business collaboration.
Lippel and Horn spoke at the recent Tableau Manufacturing Summit, you can view on-demand recordings from the summit here.
Related stories

Johnson Matthey uses Tableau to optimise inventory management
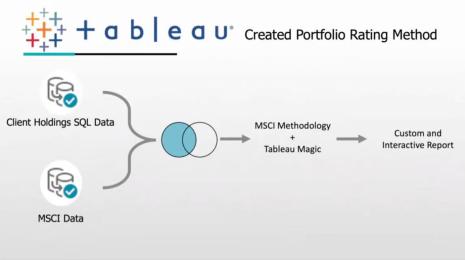
Tableau delivers ESG reporting to investment bankers ahead of regulatory demands
Subscribe to our blog
Get the latest Tableau updates in your inbox.