Best of the Tableau Web: it's Iron Viz season!


Hello everyone and welcome to the latest round up of the Tableau community highlights.
July is typically a quiet month. For a lot of people it’s because of vacation, but for many it’s because focus turns to Iron Viz. As I write, at the start of August, entries have closed and the judging process begins for the final contestants who will battle it out for the 2020 Iron Viz championship.

We will soon be showcasing all the entries l on the Tableau Public blog, but in the meantime, you can check out Will Sutton’s collage of the entries announced via Twitter. As always, the imagination, the ingenuity and the insights are a wonder to see. I applaud everyone who entered.
A favorite part for many of us, myself included, is when people explain the process behind their entry. If you’ve thought about doing this, I highly recommend it. In doing so, you give others a chance to see under-the-hood, find out about the data challenges and the justifications for all those choices you made. These lessons are great for anyone learning to be an analyst.
They’re also great for you, as an author. You have the ability to reflect on the experience and consider the merit of each decision. Should you be wishing to develop your career as a Tableau expert, this kind of post is an excellent addition to your portfolio: it shows the depth of your thinking process.
One part of a winning Iron Viz entry is in getting the small details right. As always, the Tips and Tricks and Design sections below are full of little ideas that might inspire you. Using transparent shapes has become something of a “technique” to enhance a design - Lindsay Betzendahl and the Flerlage twins have got lots of detail for you to dive into on that topic. Jisell Howe has a clever way to use dynamic shapes. Interworks have ideas about getting labels and annotations looking smooth. Klaus Schulte was inspired by Cedric Scherer to create a “lollipop-jitter plot” in Tableau. If you’re new on your Tableau journey, and those seem intimidating, I recommend Ella Worsdale’s “Tips for Tableau Newbies”, Katrina Johnson’s “Top 5 Beginner Design Tips” and Ivett Kovacs’ Design Guide.
As always, enjoy the list! Follow me on Twitter and LinkedIn as I try and share many of these throughout the month. Also, you can check out which blogs I am following here. If you don’t see yours on the list, you can add it here.
Tips and tricks
Eric Parker Color a Selected Data Point in Tableau
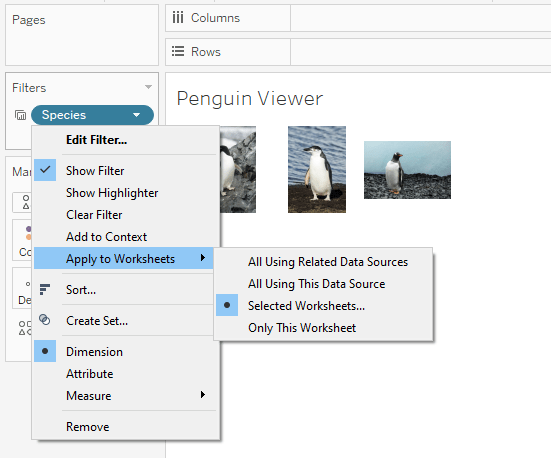
Jisell Howe Picture Perfect Penguins – Dynamic Tableau Shapes
Ella Worsdale My Top Five Tips for Tableau Newbies
Eric Parker Get Date Fields to Do What You Want in Tableau (Date Parts vs. Date Values)
Ethan Lang How to Automatically Compare Date Periods in Tableau
Klaus Schulte Creating Lollipop-Jitter Plots in Tableau
Gheorghe Ghidiu Take Control of Your Chart Labels in Tableau
Lorna Brown #TableauTipTuesday 2020 Week 31: How to Nested Sort
Rajeev Pandey How To Extract Tableau Field Information Using Python API
Ken Flerlage How to Perform Multiple Pivots in Tableau Desktop
Formatting, design, storytelling
Ivett Kovács Design Guide Part 1 – Framework & Layouts
Kevin Flerlage 14 Use Cases for Transparent Shapes & Images
Lindsay Betzendahl Using Blank (Transparent) Shapes for Navigation Buttons
Katrina Johnson Top 5 Beginner Tableau Design Tips
Tableau Prep
Carl Allchin How to... add in your data source name (automagically)
Daniel Grady, Sasha Singh Tableau Prep Builder best practices: Designing with performance in mind
Carl Allchin How to... Output to a Database
Gheorghe Ghidiu Using Python with Tableau Prep
Related stories

Meet Iron Viz 2024 Finalist Jessica Moon
 15 April, 2024

DataFam Roundup: April 8–12, 2024
 12 April, 2024

Meet Iron Viz 2024 Finalist Pata Gogová
8 April, 2024
Subscribe to our blog
Get the latest Tableau updates in your inbox.