Iron Viz at TC Europe struck a chord with music data


Editor’s note: This post was last updated on June 27, 2019. To see the latest update, please view this blog post.
This year, Iron Viz Europe hopped across the Channel to Berlin with Tableau Conference Europe 2019. It’s incredible to think just how far Iron Viz Europe has come in just three years! Debuting Iron Viz at Tableau Conference on Tour to a sea of confused faces, it’s grown quickly to fill a room of over 2,000 enthralled members of the Tableau #DataFam.
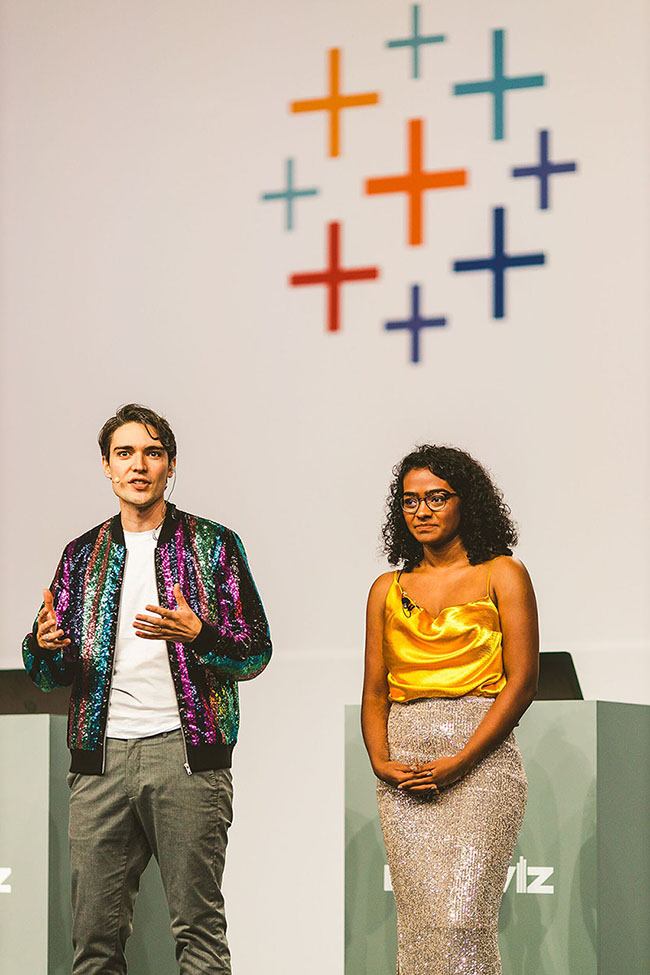
Backstage, myself and co-host, Louis Archer, could feel the buzz of excitement from the other side of the curtain: the audience in anticipation of what incredible data stories were going to be told in this year’s vizzes. We took to the stage in the sparkliest of outfits—it’s not Iron Viz without some sequins—and invited our three incredible contestants to join us on stage.
They were there to analyse historical data about Europe's—and Australia’s—favourite all-singing, all-dancing extravaganza: the Eurovision Song Contest. (Australia’s love of the contest earned the country an invitation to participate.) With almost 50,000 rows of data spanning 44 contests, our data set contains thousands of points scored over the years. We included every douze (twelve) points, which is the highest one country can give to another, to every nil points, which is unfortunately a familiar score to me as a Brit; although the UK has performed well in the past, there hasn’t been a winning act since 1997. Expectations were high and the audience was intrigued by what they might learn.
Follow our amazing contestants on Tableau Public, Anna Dzikowska, Simon Stusak, and Tristan Schouten. Each finalist competed in the Iron Viz Europe qualifier contest about Energy & Sustainability with the following entries. Check out the vizzes that won them their place on the big stage:
- Simon Stusak, a business intelligence specialist in Munich, Germany submitted his entry, “The European Union Emissions Trading System (EU ETS) Combatting Climate Change?”
- A health economist from Poland, Anna Dzikowska, submitted her entry, “Coal Plants Make Europe Sick.”
- Tristan Schouten, a data analytics consultant from Amsterdam, Netherlands, created this viz for his entry, “The Cost of Energy Independence.”
Read more about the qualifier contest and the compelling visualizations that brought these finalists to the big stage in this blog.
The final was an impressive swan song
The final was a whirlwind of vizzing with three amazing creations built in just 20 minutes. Our panel of expert judges included Zen Masters Ann Jackson and Klaus Schulte, who was last year’s winner, alongside Tableau’s own Rafi Zelikowsky and Andy Cotgreave. The judges had their work cut out for them, judging the vizzes based on three criteria: Analysis, Storytelling, and Visual Design.
Let’s meet the finalists and see how they made sweet music with their impressive vizzes.
Tristan Schouten busted myths by harmonizing with toggles and tiles
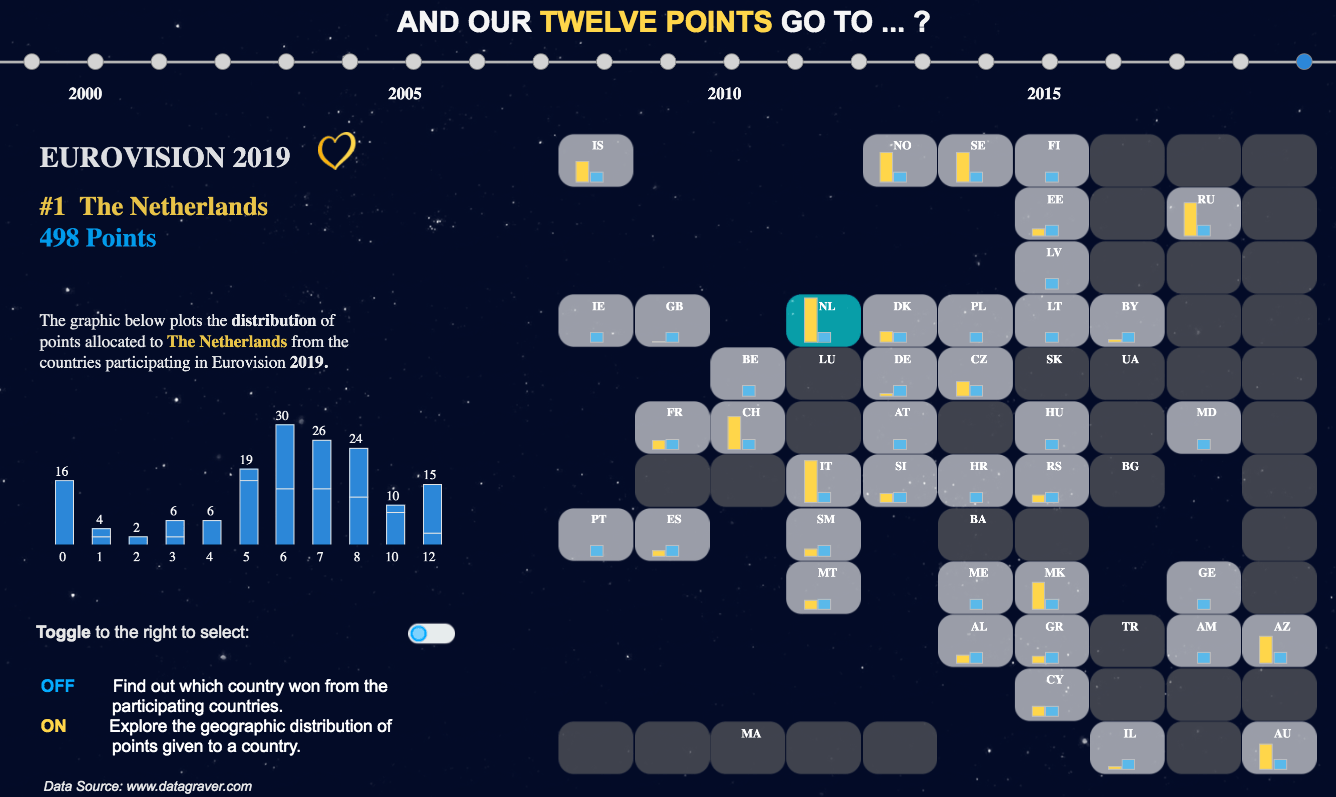
Ably assisted by sous vizzer, Sofya Bratus, Tristan’s viz sparkled and busted myths. He told a tale of how although the country with highest total score always wins—it’s not always the country that has the most maximum points that takes home the grand prize. Tristan’s home country of the Netherlands won the contest in 2019 by scoring six, seven, and eight points the majority of the time.
His tile map of Europe illustrated how many points each country scored over time, inviting people to toggle, revealing the pattern of how neighbours vote for each other. Tristan cleverly layered in a bar chart to show the distribution of points over the top of each country's tile.
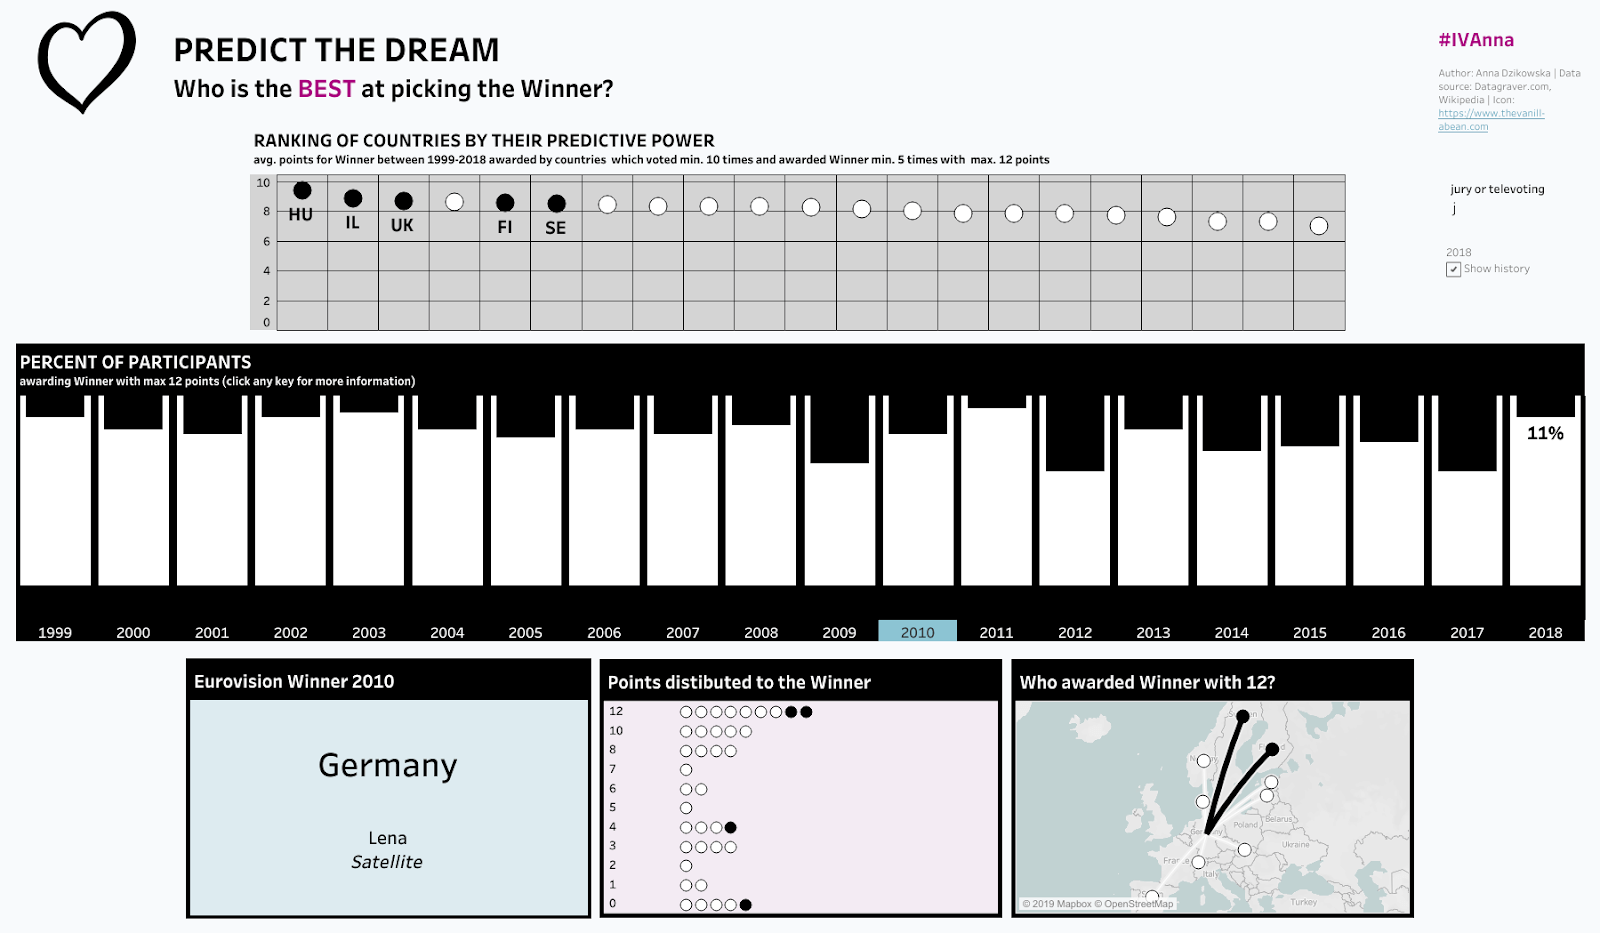
Anna Dzikowska hit the high notes with spatial functions
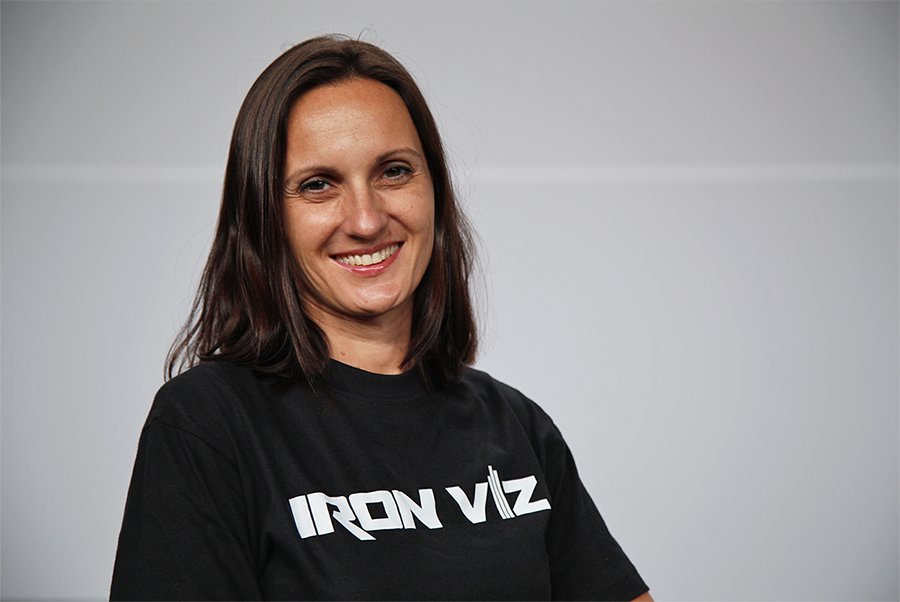
Teaming up with sous vizzer, Tom Christian, Anna focussed on the predictive powers of five countries that have been successful at picking the winning country. Anna showed how, statistically, these countries are the best at awarding points. Apparently, the Hungarians, the Brits, the Israelis, the Swedes, and the Finns all have impeccable taste in Eurovision entries.
Her viz was very clearly inspired by both the keys of a piano and the fretboard from a guitar, demonstrating great use of the new MakeLine feature in Tableau 2019.2 to show origin and destination of points given and received on her map.
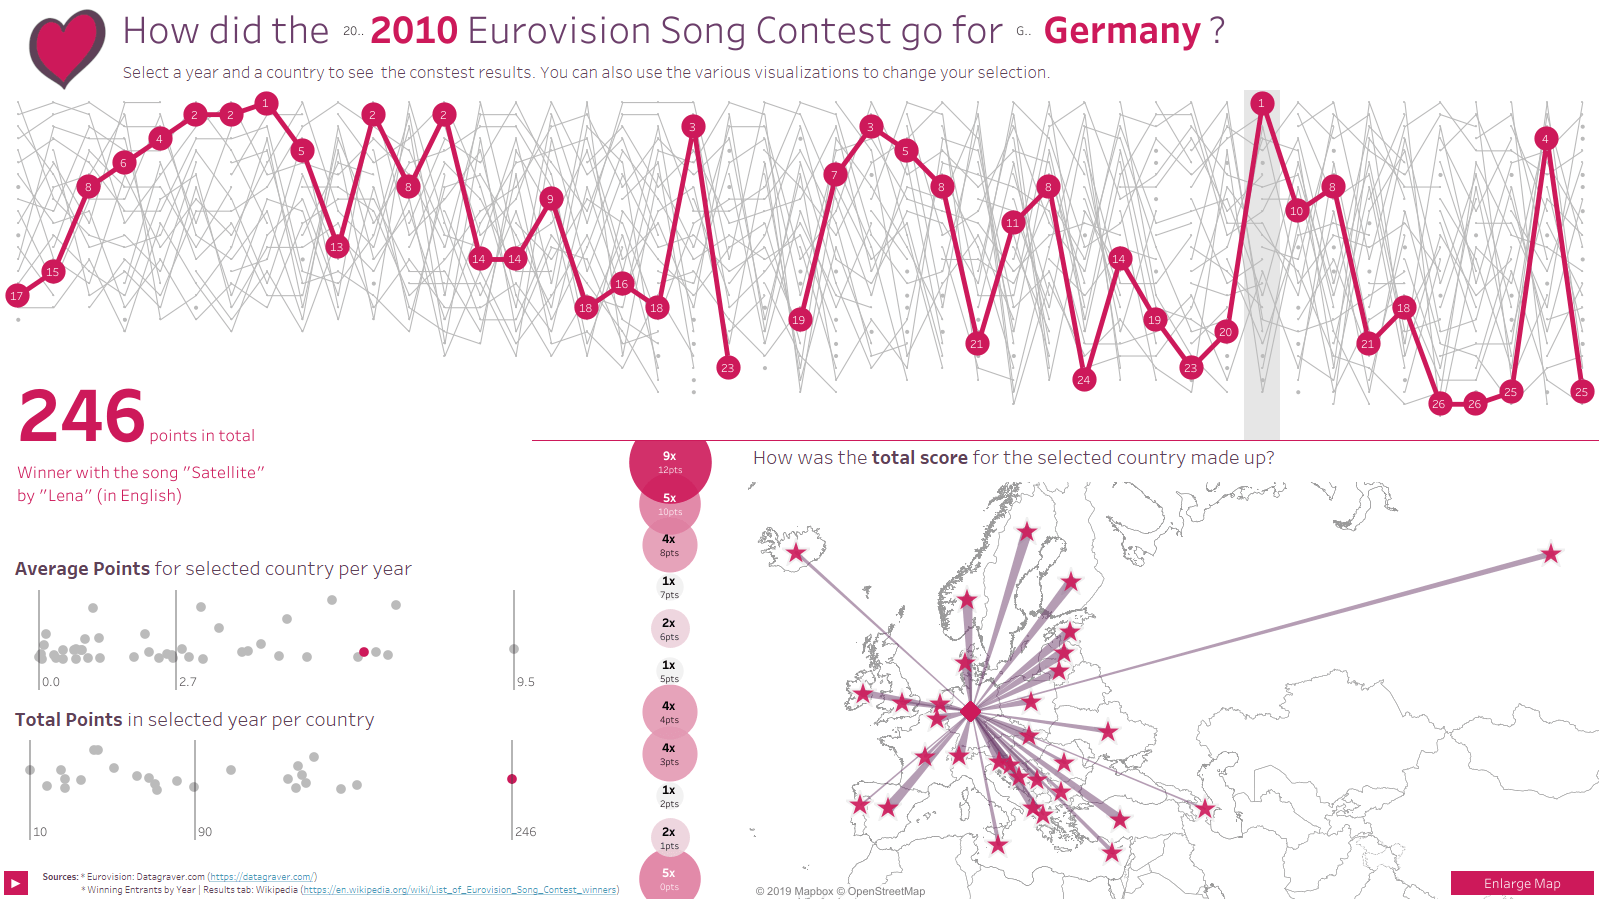
Simon Stusak took (parameter) action as he mapped out the history of points

Doubling up with sous vizzer, Marc Montanari, Simon’s viz answered a series of questions: how did a country fare in a given year? What were their average and total points scored? How did they compare to prior years? And who awarded them points from across the continent—and Australia?
His viz made use of parameter actions, also new in Tableau 2019.2, to drive interactivity across all of the different charts on the viz.
In a smart move to allow people to take a closer look at the geographical information, Simon gave us a much larger map to examine, using yet another new feature that allows containers to be hidden and revealed at the press of a hot pink button.
Congratulations to our winners, Anna and Simon!
The tension in the hall was palpable as Klaus, Ann, Andy, and Rafi conferred and debated on whose vizz best displayed superior design, analysis, and storytelling. Louis collected the golden envelope as the audience collectively held its breath. The Iron Viz Europe Champions are Anna Dzikowska and Simon Stusak!
If you couldn’t make it to the big show this year, watch the recording to enjoy the outfits, data and music puns, and impressive vizzing.
For those of you that would like to play with music data, our next global feeder competition for Iron Viz is currently open! You can find out more and enter the qualifier contest here. Win or learn—you can’t lose.
Related stories

Visualizing Women's Impact to History Through Data Visualization
 18 March, 2024

Behind the Viz: Adrian Zinovei Helps You Design Your Next Dashboard
1 March, 2024

Charting the Heart: Data Visualizations on Love
 14 February, 2024
Subscribe to our blog
Get the latest Tableau updates in your inbox.