Tableau Online tips: 4 ways to share your analytics
When it comes to analytics, sharing is caring.


Editor’s Note: Tableau Online is now Tableau Cloud.
This post is part of our series covering tips, tricks, and ideas in Tableau Online, our cloud collaboration and sharing platform.
When it comes to analytics, sharing is caring. But what options do you have for sharing? How do you encourage others to ask questions of your data? Better yet, how do you put dashboards and visualisations where they’ll be seen the most? Don't worry – we're here to help.
Sharing views
After you've published your workbook(s) to Tableau Online, you can share any view with anyone on your site. Perhaps you want to show a colleague a certain visualisation within your published workbook. In times like these, it’s easy to share links with others by pasting them into an email. Simply click the share icon in the toolbar, copy the URL in the Link field and paste it into your email. 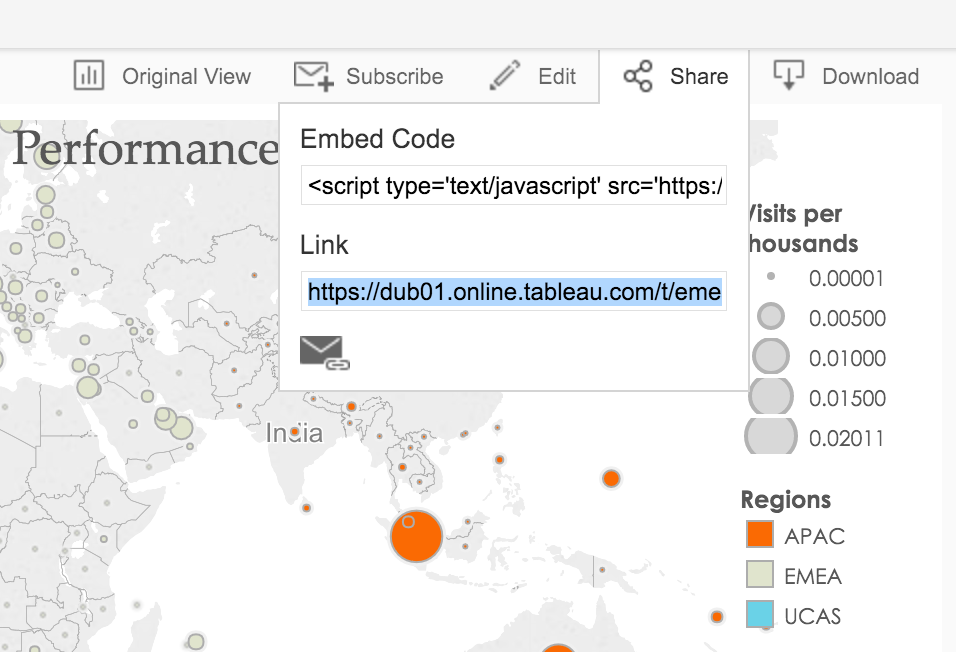 But imagine you’ve discovered something really important in a certain product group or manufacturing site. Rather than sending a link to the original dashboard and describing how to find your specific insight, you can save the specific set of filters and highlights you’ve already created in Tableau Online. When you are ready to save your custom view, click the Original view button in the toolbar. Give your custom view a name and click Save. Now anyone with access to the dashboard can easily access your custom view by selecting it from the list in the Original view menu. You can also copy and share the URL, just as you did above.
Subscribing to views
We spend hours (perhaps too many!) each day in our email. And many people prefer to get email updates of their favourite dashboards right in their inbox. Using the Subscribe button in the toolbar, you can subscribe to dashboards and get updates delivered directly to your inbox on a set schedule. You can also subscribe other site users if you have the permissions to do so. 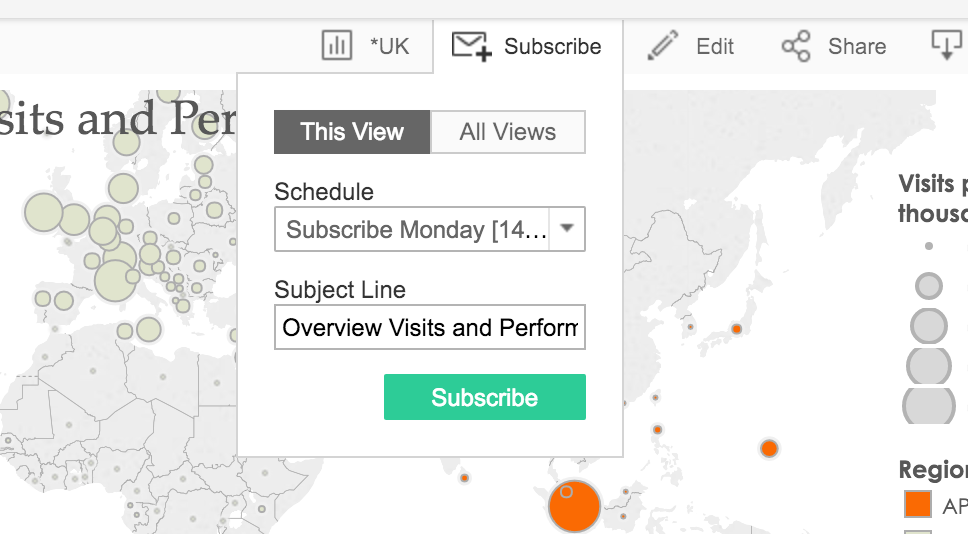
Sharing data sources
There are probably people in your team who’d like to ask their own questions of data. But they don't know the underlying data source very well. Publishing a data source empowers them to create their own analyses without worrying about the underlying data. When you publish a data source, it retains the joins, unions, groups, hierarchies, calculated fields and all other modifications you've made in Tableau Desktop. This makes it easy for anyone to build an accurate analysis, regardless of their ability to work with metadata. When publishing your data source, make sure you set the right permissions. Most databases or applications have their own credentials, and you’ll need to embed them in the data source if people will be accessing it from Tableau Online.
Embedding your views
Another powerful way to share your insights is to put your visualisation in places where people are already looking. That’s why we make it easy for you to embed your dashboards in other websites, company portals or apps. Simply copy and paste the embed code for a dashboard and place it in an iframe.  If you want to create a seamless single sign-on experience for your users, you can use SAML authentication. When using a SAML identity provider (IdP) like Okta or OneLogin, Tableau recognises a viewer’s identity, meaning you’ll never have to enter a second level of authentication to see your viz. If you are looking to integrate your Tableau dashboards into web apps on an even deeper level, check out our great resources on the Tableau Javascript API.
Related stories

Securely Access and Analyze All of Your Data with Data Connect for Tableau Cloud

Should I Move My Analytics to Tableau Cloud?
 30 January, 2024

Tableau Bridge: A Guide to Seamless Data Connectivity with Tableau Cloud
Subscribe to our blog
Get the latest Tableau updates in your inbox.