Tackling Survey Data with Informatica Rev and Tableau


At Tableau we love solving problems for our customers. Often we do this by partnering with other technology companies and figuring out how to integrate our solutions to make the life of data workers easier. Informatica recently released a self-service data prep solution called Rev (formerly Project Springbok) which is purpose built to help get people out of the day-to-day spreadsheet shuffle by making data preparation a snap. Even better is that it has the capability to output directly to a Tableau Data Extract allowing for a quick transition from clean data to clean analytics. Here to share more about how Rev is especially helpful for Tableau users working with survey data is Informatica Product Marketing Manager, Dan Ganancial.

Dan Ganancial, Product Marketing Manager at Informatica
Surveys are a time-honored method for gathering information from a large group of people to then distill sentiment and motivation through analysis. Whether it is businesses trying to better help serve their customers, colleges and universities learning more about their students, or even organizations polling to find out how they can improve employee satisfaction, surveys are a critical tool for helping capture the differing opinions of the masses.
Yet, many times the most important revelations in survey data remain hidden due to the inherent difficulties in shaping the raw response data before performing meaningful analysis. Tableau helps everyday users overcome the hurdles in asking questions of survey data, but sometimes before even getting to visualize the results the data needs to be prepped. Physically reshaping thousands of rows of survey submissions can still prove a big challenge and one that most data workers loathe to take on.
The integration between Tableau and Informatica’s new self-service cloud data preparation solution – Rev – means that the hours people spend manually shuffling, transposing, and combining data in order to get their survey responses ready for Tableau can now be condensed into minutes.
Informatica’s Rev (formerly known as Springbok) takes the complexity out of many of the manual tasks you might do in Excel to get your survey data ready for visualization in Tableau. Rev makes it especially easy to re-shape your data so that “wide” data can quickly be converted to “tall” data and more effectively used in Tableau to uncover trends in survey responses.
Let’s take a look at how to use Rev with Tableau to more effectively work with survey data.
Get Started
First steps first, you need to get your data into Rev so that you can start cleaning, re-shaping, and preparing the data for Tableau. Rev is free to use. Simply sign up for Rev and log into your account. Once logged in, create your project and then continue to Import your survey data from a database or spreadsheet.
Watch this short video on how to create a new project. Don’t worry about our different product name … our code name was Springbok before we changed to Rev.
Reshape Your Data
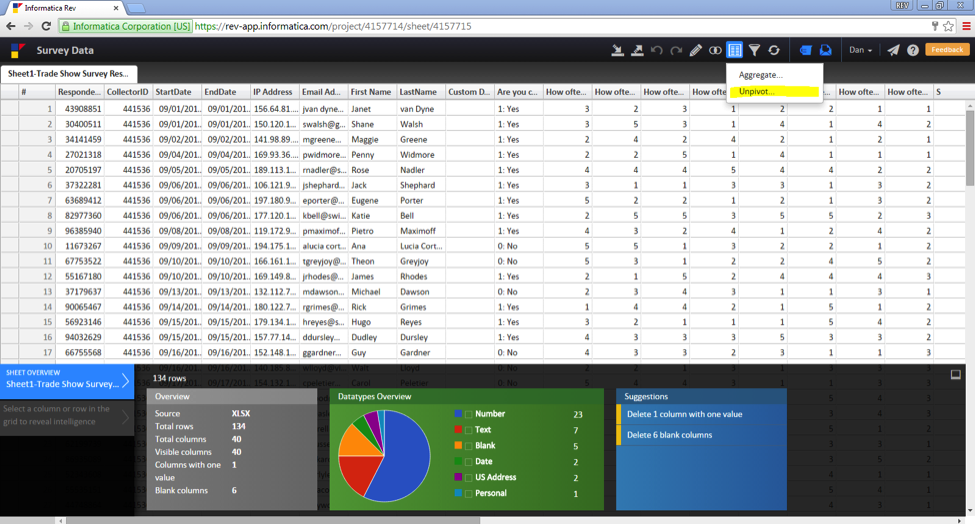
More than likely your survey will have Likert Scale questions where the data you receive will have each question as a separate column heading. Tableau prefers to work with “normalized” data where there is a separate row for each question in the survey and the answer data is repeated for each survey respondent. Trying to unpivot all this data in Excel could take a long time.
Rev makes it very easy to do in a few simple clicks. Watch your data get reshaped in a just a matter of seconds. Click on the Summarize icon and select Unpivot.
You can view what columns will and will not be unpivoted in the profiling boxes below. Click on Change in the ‘Unpivot Columns’ box to then de-select which columns of data you do not want to unpivot.
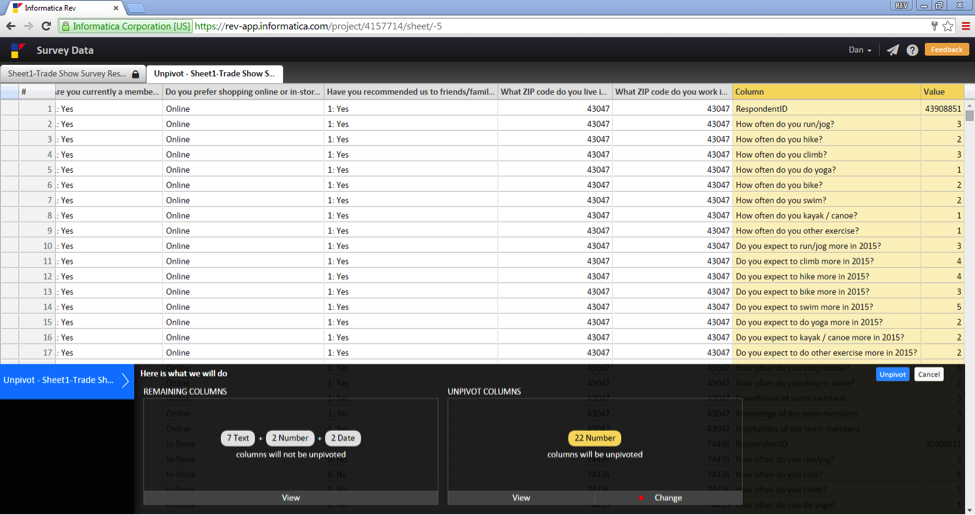
Simply click on Done and then Unpivot to make your changes final and “normalize” your survey data.

Clean Up Your Data
Do you have inconsistent values in your data? You might have asked a Yes/No question but allowed respondents to type in their response. Most may have typed in Yes or No, but some may have typed in True or False. Unfortunately, this inconsistency in response could mess up your analysis. Rev makes it easy for you to find the True/False values and quickly change all of them to Yes/No. Select the column with this information to rapidly change and re-profile the values.
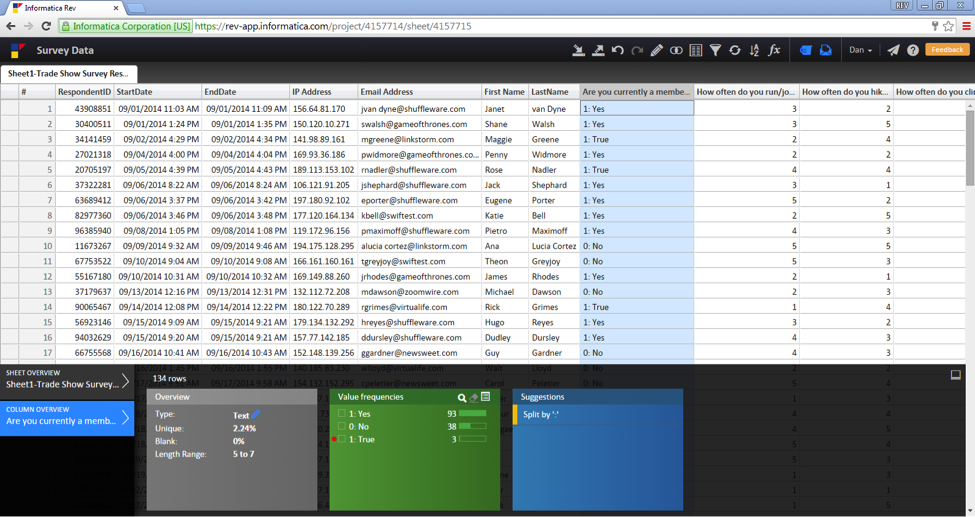
In the ‘Value Frequencies’ box below, double-click on the value you want to update.
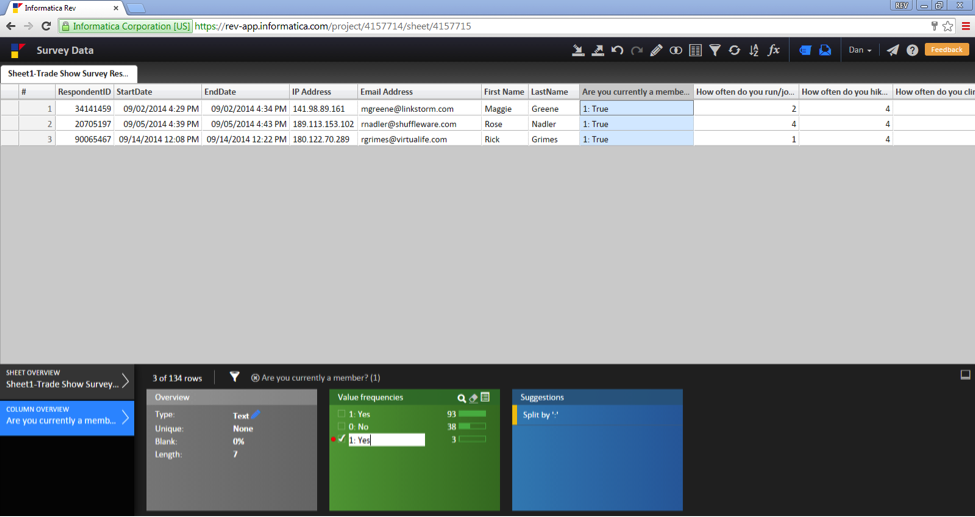
Enter in and submit your new value and Rev rapidly updates and re-profiles your information.

Combine Separate Files
Do you need to combine your survey data with more information about your respondents, but these datasets sit in separate files? You could write a VLookup formula in Excel to do this, but that might take a lot of time (especially if you’re not savvy with Excel formulas). Rev can quickly combine your datasets together in a few seconds. No formula-writing required and the combine done in just a few clicks.
Once you’ve imported your other data file into your existing project, all you need to do is perform the combine. Here’s another short video to show you how to do this.
Validate Respondent Information
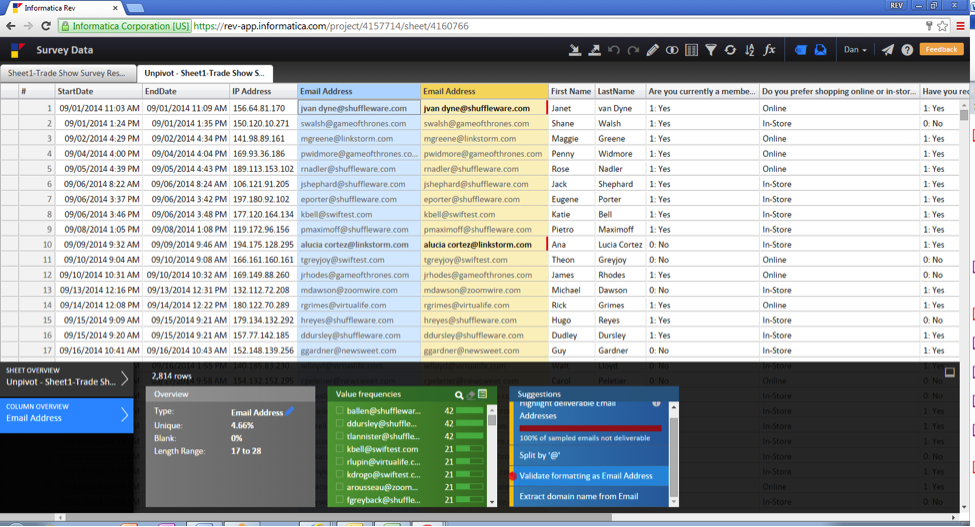
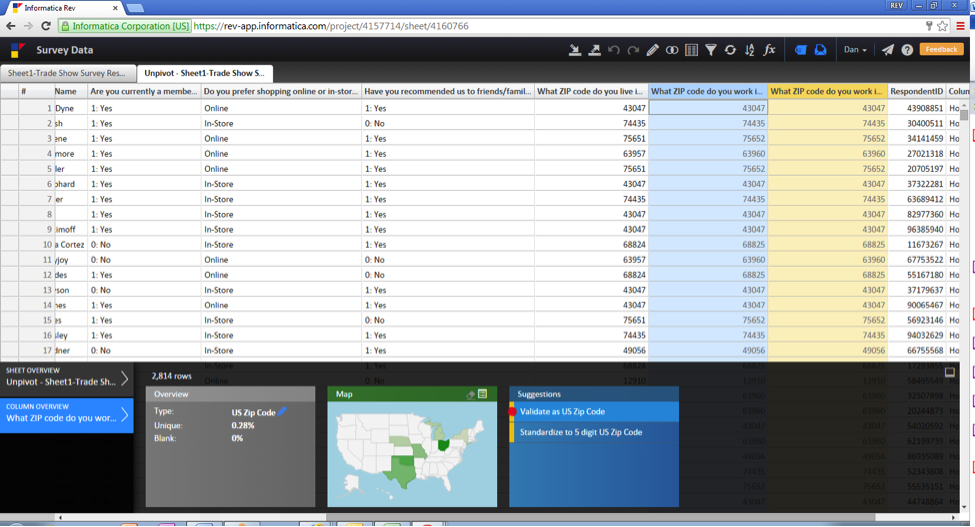
If you plan to follow up with your survey respondents, then you should make sure you have valid contact information for each of them? It’s time-consuming to manually check each email address or zip code to make sure all are legit. Rev will do it for you in a matter of seconds.
Simply click on the email address column and select the Validate formatting of Email Adress option from the ‘Suggestions’ box below. Rev quickly identifies which email addresses are invalid.
What about validating zip codes? Rev will take care of it for you. Click on the zip code column and select the Validate as US Zip Code option from the ‘Suggestions’ box below.
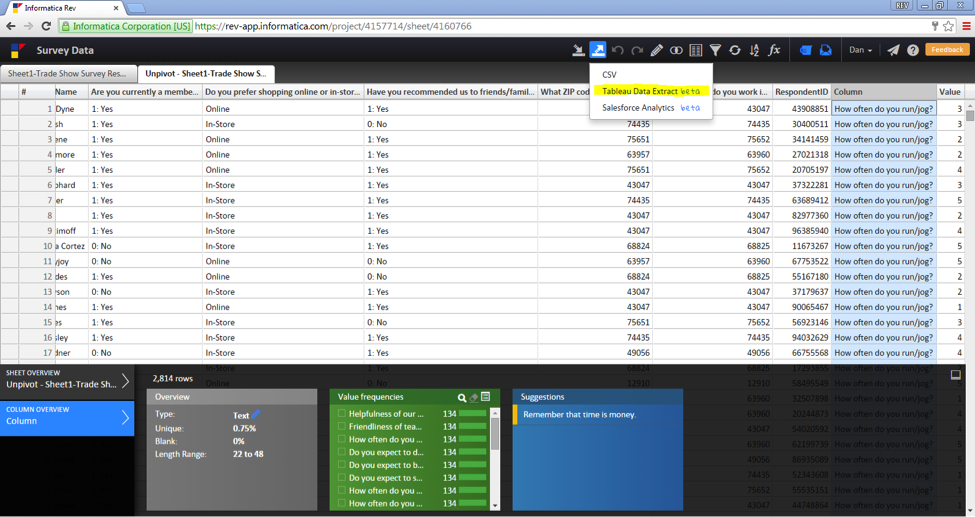
Export Dataset For Tableau
Once you’ve finished reshaping and preparing your survey data, easily export your dataset in a file format ready for immediate analysis and visualization in Tableau. Rev’s TDE Extract means you don’t have to spend time inputting your data into Tableau. Simply click on the Export icon to download a Tableau Data Extract file of your data. Open up your downloaded file in Tableau and you’re ready to start analyzing and visualizing.
Working with survey data shouldn’t be a hard thing, and it definitely should not take you hours upon hours to get your data fit and ready for visualization in Tableau. Reduce the time it takes you to work with data. Sign up for Rev and go from data drudgery to analytic awesomeness!
Want to see a survey data project in action using Rev and Tableau? Watch this video!
Subscribe to our blog
Get the latest Tableau updates in your inbox.