Check Out These Data Whiz Kids!


Here at Tableau, we get to be astounded every day by the creativity and brilliance of our customers. But perhaps even more amazing are the tales we've been hearing lately—of kids who are playing with Tableau, and reaching some pretty sweet insights at that.
We decided to look further into the phenomenon, and quickly discovered some amazing stories about these mysterious beings—who we've named #datakids. For example, we learned that an InterWorks consultant has a daughter who's been giving lessons on scatterplots. Intrigued, we looked up this video:
Our own Jessi Thorp—one of the rockstars on our Events team—then revealed that she knows another young data whiz. This June, she brought her 11-year-old nephew, Conner, to the office at the start of his summer vacation. It was the day after we released Tableau 8.2, and he became the first kid to use Story Points.
We want to hear your stories of the #datakids in your life. (Go on—tweet us!) But first, here's Jessi's:
Data Storytelling During Summer Vacation
HOLD THE PHONE! “You dig technology?” I ask him.
“Yeah, I want to work with computers or gaming one day."
I'm thrilled because I have the perfect opportunity to introduce Conner to technology and a fun work environment. I decide to invite him to work with me the next day and have him log my receipts in Excel so I can find them easily for a past-due expense report. (That’s the honest truth.)

When we get to the office the next day, I grab my receipts and open Excel to have Conner start recording my receipts. Then he tells me he doesn’t know how to type. Shocked, I realize I need to change my game plan. I decide I'm going to help Conner learn to type—and I'm going to have him create a data visualization about it.
After just 3 or 4 lessons, Jock Mackinlay, Tableau’s VP of Visual Analysis, stops by our row of desks. "Conner, remember when I told you I get to work with brilliant people?" I ask him. "Well this is one of them." Jock pulls up a chair and asks Conner what he's interested in at school. After a chat about robotics, Conner wraps up his sixth typing lesson and I decide it's about time to grab some lunch!

We take a delicious break. Then after lunch, I have Conner enter his data from the whiteboard into Excel. Now, the epic moment can begin. I take twenty minutes from my busy day to show him the basics of Tableau Desktop.
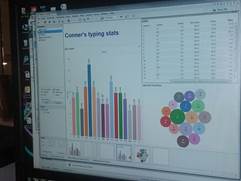
He responds quickly: “My best keys and my top score.” With a quick sort, he’s able to see that F and J are his strongest keys. “This is so cool!” says Conner. “I wish I could have it at school.”
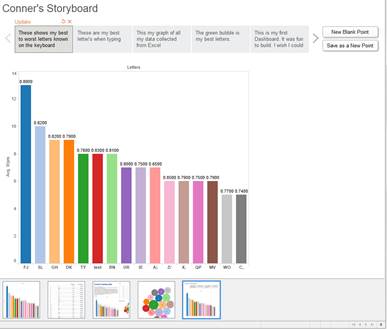
We stop to admire his work… Then I introduce him to Story Points! “Stories are a way to highlight the data that matters most to you,” I explain.
5:00 p.m. approaches quickly, and I realize we’ve been playing with Tableau for most of the afternoon! But I consider the day a success. After all, not only did I help my nephew finally learn to type… I’m also pretty sure he’s become the first kid to ever use Story Points.
Yep, #Datakids are Amazing!
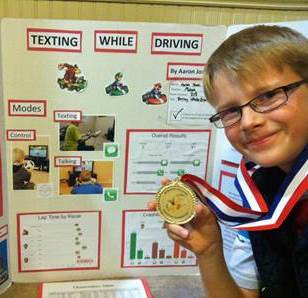
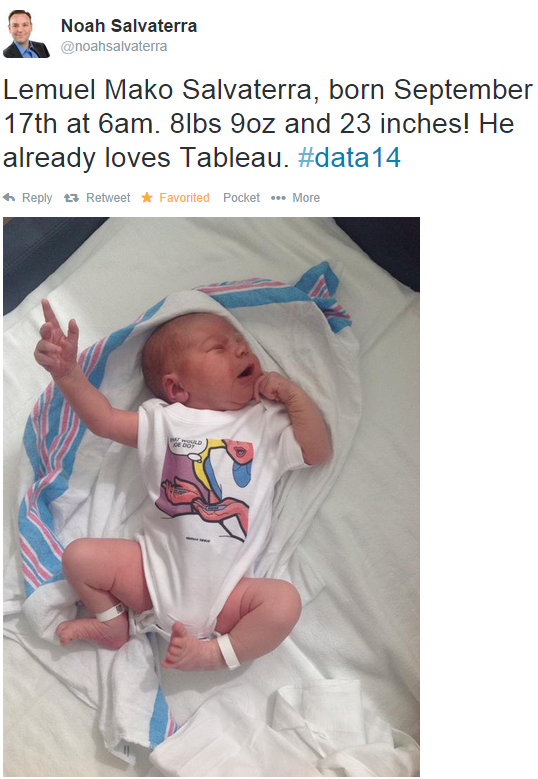
And there are a lot more out there than we first realized. Here's Ben Jones' son, who used Tableau for a science fair project. And Noah Salvaterra is getting his little one started early! However, Noah did admit:
"Lemuel Mako Salvaterra is only a week and a half old and it is unclear that he has chosen a favorite tool for data visualization. At this point and his current needs are somewhat modest in that regard, but he still has a few days left on his two-week trial."
Do you have a story or picture of a young data rockstar? Don't forget to share it! Use the hashtag #datakids to post it on Twitter, as well as Facebook and Instagram. We can't wait to hear about their data shenanigans.
Related stories

Visualizing Women's Impact to History Through Data Visualization
 18 March, 2024

Behind the Viz: Adrian Zinovei Helps You Design Your Next Dashboard
1 March, 2024

Charting the Heart: Data Visualizations on Love
 14 February, 2024
Subscribe to our blog
Get the latest Tableau updates in your inbox.