What is the Value of Visualization?


V = T + I + E + C
Does the above equation contain all you need to know about measuring the success of your visualization? John Stasko thinks so, and he explained why in his keynote at EuroVis 2014, in Swansea, last week.
What does it mean?
T = The ability to minimize total time needed to answer a wide variety of questions (without formal queries, ie not needing to know SQL). It’s a fallacy that all visualizations should be understandable in an instant. Some are inherently complex. The trick is to do the task as quickly as possible.
I = The ability to spur and discover insights or insightful questions about the data. If you don’t learn anything from your visualization, you have not succeeded.
E = Ability to convey an overall essence or take-away sense of the data. The bigger picture is important. This reminded me of Ben Schneiderman’s visualization mantra: Overview – Zoom and Filter – Details Demand. The point is that it’s great to be able to see details but you must also be able to see the whole. He used the excellent Map Of The Market as an example. Consider the image below: do you think this was a good or bad day?.
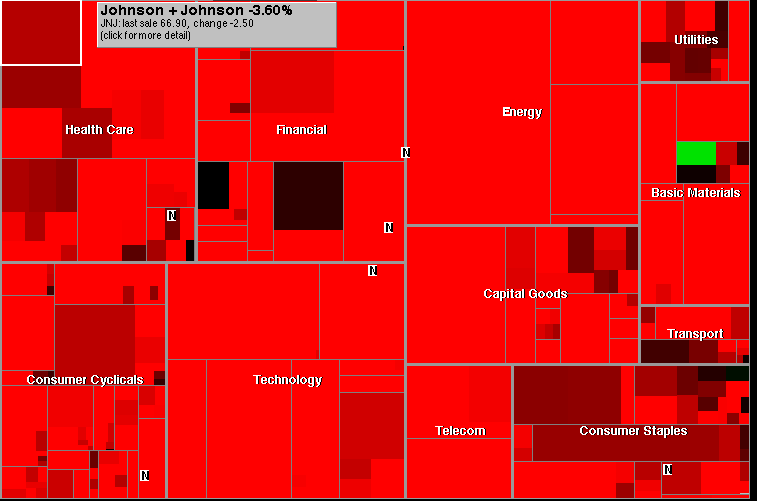
(image from User Interface Engineering)
C = Ability to generate confidence and trust about your data its domain and context. If you are not the author, you need to be able to convey your information in such a way that the audience trusts your work.

(Salaread by Pratik Zaveri)
He also made the key point that “simply presenting the data can have a profound impact.” He illustrated this with a story about one of his students who collected publicly available faculty staff salary data and visualized it. The data was available publicly, but hard to access. The student made it simple to see. Once it was made accessible and visualized, people got upset. Why is this? It was data presented simply. The same thing happened regarding gun ownership.
What do you think? Is this a useful model for measuring the value of visualization?
Tableau is delighted to have been able to sponsor the EuroVis 2014 conference. If you are a teacher or student and want to try Tableau, you are eligible for free access through our academic programme.
We also loved visiting Swansea – which felt more like Barcelona this week!

Related stories

Visualizing Women's Impact to History Through Data Visualization
 18 March, 2024

Behind the Viz: Adrian Zinovei Helps You Design Your Next Dashboard
1 March, 2024

Charting the Heart: Data Visualizations on Love
 14 February, 2024
Subscribe to our blog
Get the latest Tableau updates in your inbox.