Tableau European Customer Conference: Mission Accomplished


Wednesday, after the second day of sessions including keynotes from Stephen Few and Simon Rogers, case studies from customers and partners, hands on training, and educational talks from Tableau experts, the first ever and first annual European Customer Conference ended. As significant as all the learning was the networking and relationship building.
The day started with a enlightening and entertaining talk from Stephen Few of Perceptual Edge. He demonstrated how our eyes can do more of information processing and lift the load (so to speak) from the thinking parts of our brains. He showed that traditional business intelligence software platforms have done a good job getting the infrastructure in place but do little to help with analytics and data sense-making. I particularly loved his comment (and I'm paraphrasing thanks to Ian Taylor's tweeting), "Data is beautiful not because of how we decorate it but because of the stories it tells."
We then had four break-out sessions. During and between those break-outs, Tableau customers were networking and relationship building. You could just feel the connections strengthening.
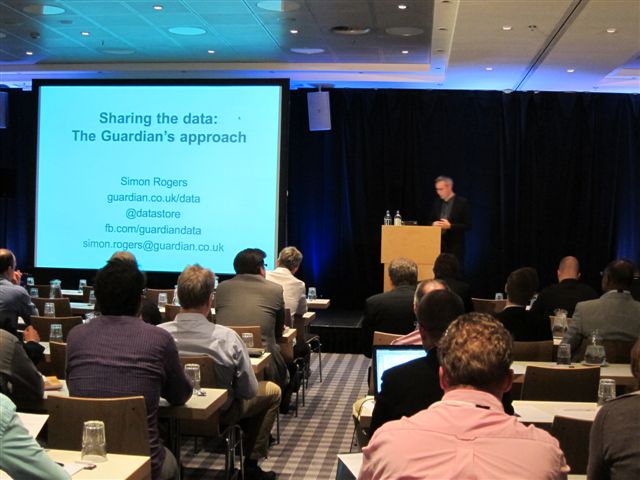
At the end of the day, we got together one more time for our closing keynote from Simon Rogers, well-known editor of The Guardian's Datablog and a truly interesting person (side note: his first day on The Guardian's news desk was September 10, 2001 - yes the day before 9/11). He flew in directly from San Francisco to tell us about The Guardian's approach to sharing data. The Guardian has made data a central part of their story-telling in part because people no longer trust journalists. They publish the raw data so people can get the facts direct. He showed a Guardian image that shows their process, from raw data to organized tables to calculations to output including story. Proof of their success? Three times the traffic of the UK Office of National Statistics. Commented Rogers, "When we started the datablog, we thought it would be developers who would use it. But it was real people."
And then, as suddenly as it started Monday morning with our 3 pre-conference workshops, the conference was over. It was a lot of work and fun - not the least of which was from our 150 customers getting to Amsterdam and engaging deeply with the content.
Our mission was to provide these "magic 150" customers the opportunity to get to know us and each other, learn, network and have a great time. I hope they agree we achieved it.
Subscribe to our blog
Get the latest Tableau updates in your inbox.