Measuring Customer Satisfaction
Many businesses have survey data somewhere, waiting for better analysis. Using a survey containing ratings from 1 to 10, this analytical view correlates ratings of overall satisfaction, firm expertise, and likelihood to recommend for several customer segments. Each circle represents a segment defined by the combination of industry, job function, gender, and product. Size corresponds to the number of customers in that segment.

Create and share on Tableau Public
Join the newsletter and find daily inspiration with the Viz of the Day. Yours could be featured next!
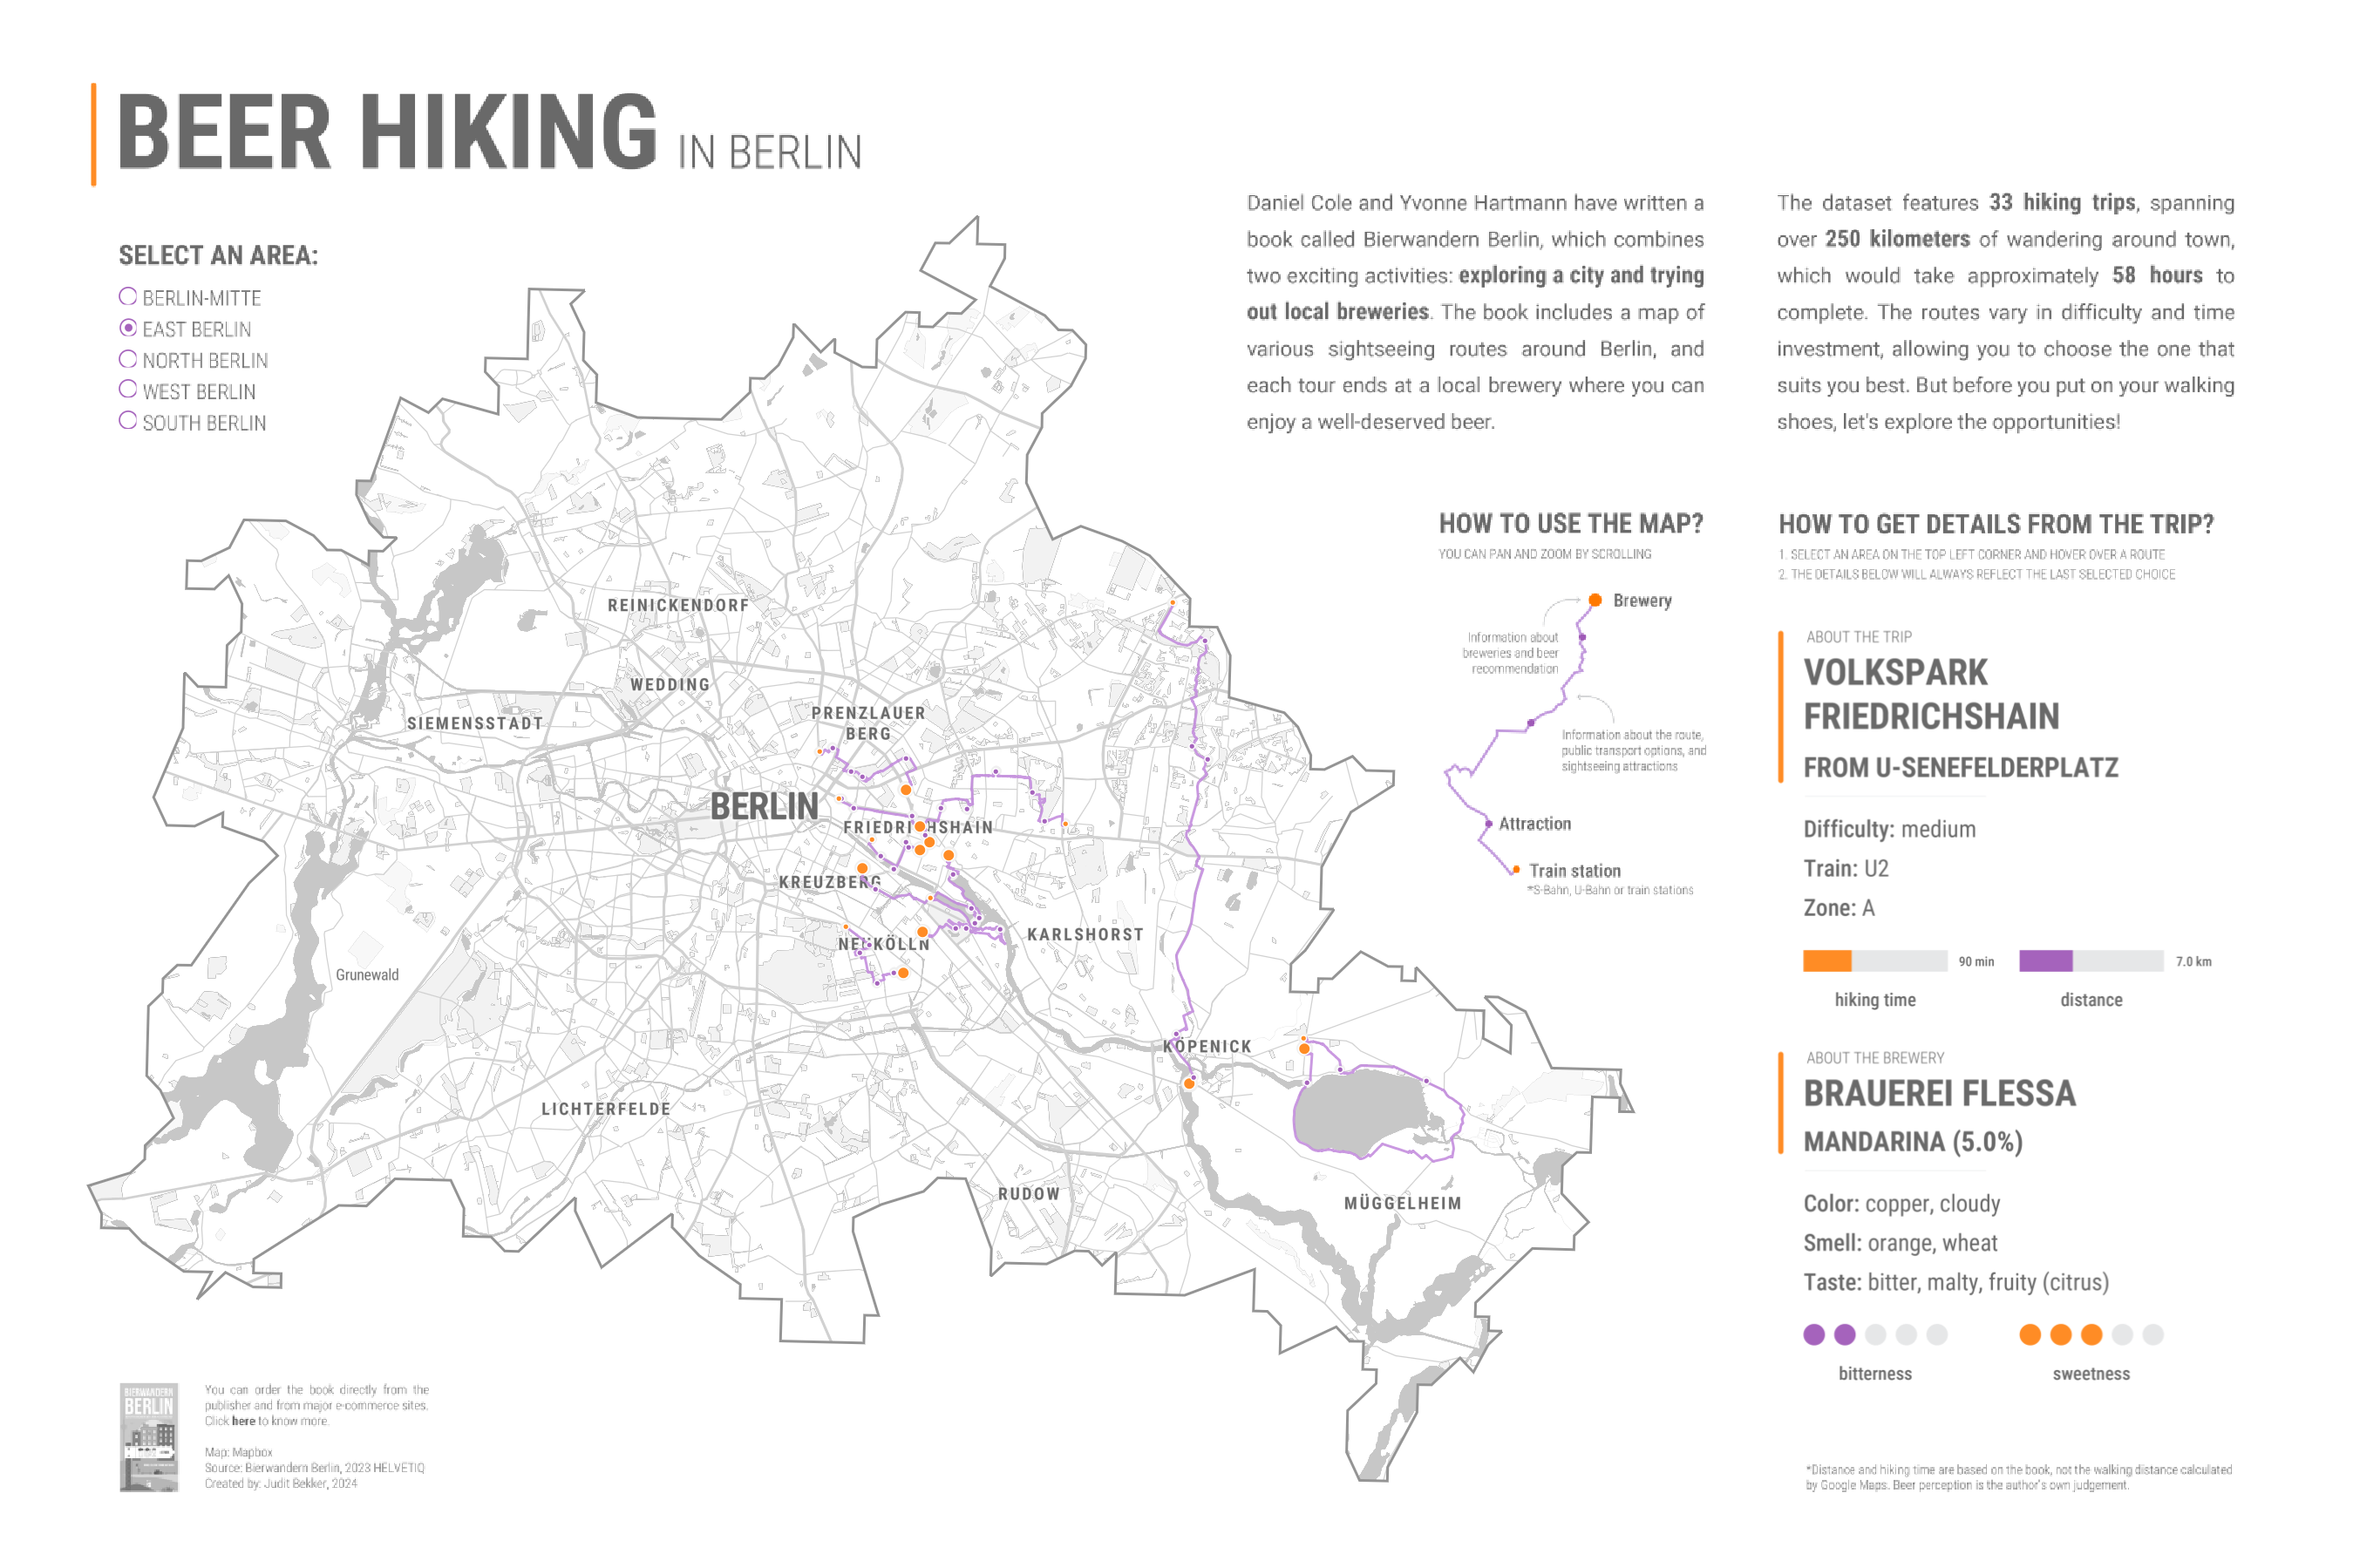
Beer Hiking in Berlin
Explore various hiking routes in Berlin, all leading to local breweries in this #VizOfTheDay by Judit Bekker. Customize your exploration by selecting different areas. A viz based on the book "Bierwandern Berlin" by Daniel Cole and Yvonne Hartmann.
Interact with the viz