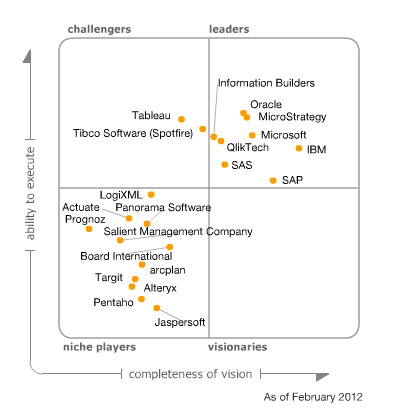
Gartner, one of the world’s most influential Information Technology analysts, is out with new reports about the costs of business intelligence platforms. We’re thrilled with how Tableau is represented. Read below for highlights. Even better, read the full reports and see how each of 25 business intelligence vendors performs. Gartner compared vendors on cost elements such as average implementation cost, license costs and other product attributes.
Implementation Cost Highlights
In its report Survey Analysis: Customers Rate Their BI Platform Implementation Costs*, Gartner has highly ranked Tableau in categories such as product quality, ease of development, average implementation cost per user (where a higher rating equals a lower cost) and average integration score. The figure below called “Product Quality vs. Ease of Development vs. Average Implementation Cost Per User vs. Average Integration Score” shows all vendors’ positions.
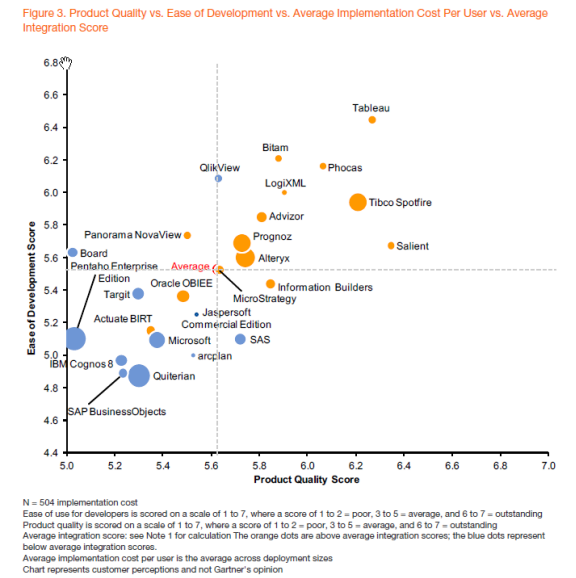
Source: Survey Analysis: Customers Rate Their BI Platform Implementation Costs, 28 September 2012, Rita L. Sallam, Gartner Research Note G00239669
In addition, Gartner also reported that their survey respondents rated Tableau as the lowest in migration complexity while also maintaining the lowest scores on migration complexity. This is shown in the figure called “Migration Complexity, Implementation Cost Per User and Business Benefits.”
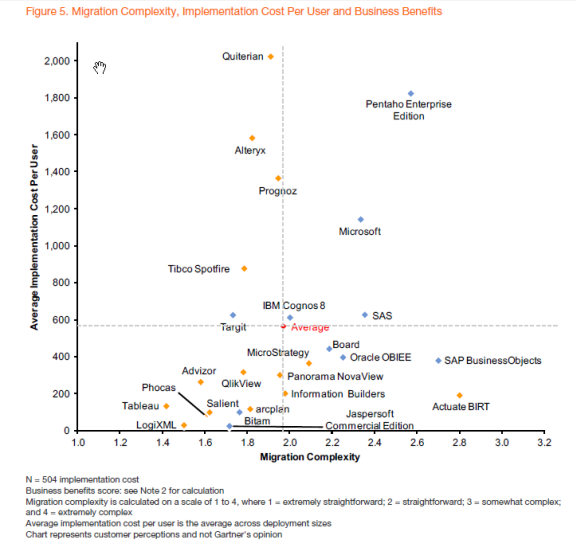
Source: Survey Analysis: Customers Rate Their BI Platform License and Hardware Costs, 28 September 2012, Rita L. Sallam, Gartner Research Note G00239670
Gartner also cited Tableau customers as reporting below average license costs per user and above average performance scores. In fact, Tableau was rated as one of just a few business intelligence vendors with a higher than average number of users and a lower average hardware plus maintenance cost. The figure below shows average deployment size versus average total hardware and maintenance cost.
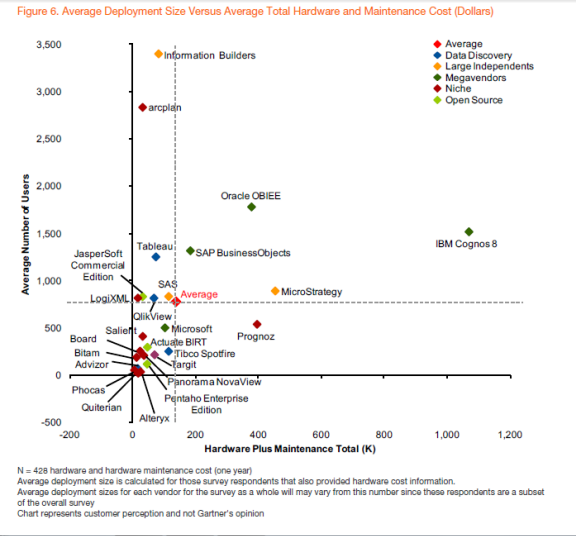
Source: Survey Analysis: Customers Rate Their BI Platform License and Hardware Costs, 28 September 2012, Rita L. Sallam, Gartner Research Note G00239670