DataFam Roundup: August 29-September 2, 2022


Welcome! Dig into this week's DataFam Roundup—a weekly blog that brings together community content all in one post. As always, we invite you to send us your content—and the DataFam content from your peers that have inspired you! Find the content submission form here.
DataFam content
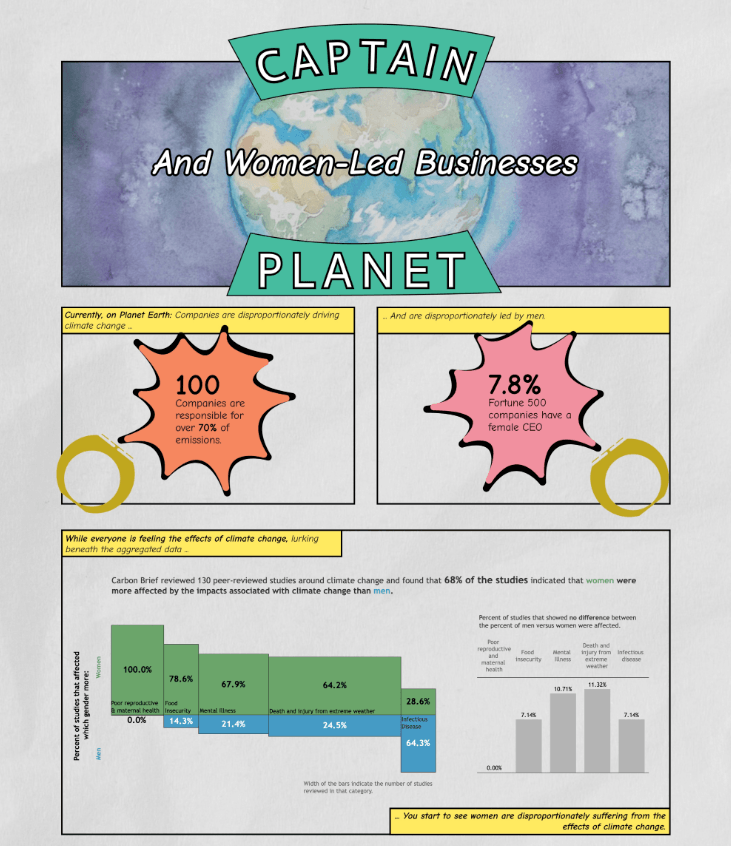
Kimly Scott, She Will Viz: Community & Captain Planet with Nicole Klassen
Dive into content created by the Tableau Community:
-
Annabelle Rincon, Rativiz: Calendar in Tableau
-
Marc Reid, datavis.blog Tableau Custom Number Formatting – Part 2
-
Brandi Beals: Tableau Catalog is Awesome - Here's Why
-
Kimly Scott, She Will Viz: Community & Captain Planet with Nicole Klassen
-
Alexander Mou, vizdiff: How to install database drivers for Tableau in Mac
-
Yash Sakhuja, VizArtPandy: How to Create Shape Layers in Tableau
-
CJ Mayes: What’s Good? The Value of Sharing Knowledge with Lorna Brown (September)
-
Andy Kriebel: The Dual-Axis Podcast with Taha Ebrahimi
-
Lindsay Betzendahl, Viz Zen Data: I Have ADHD – Part I: Breaking 5 Myths
Team Tableau
-
Re-Viz-it the Tableau Public Homepage to Discover What’s New
-
Learning Tableau Helped Me Land My Dream Job in the Music Tech Industry
Upcoming events and community participation
-
Create your first viz (dashboard) in Tableau! After two long years, no thanks to the pandemic, **WeVisualize** is back with our in-person sessions and happy to kick things off by going **back to the basics!**
-
Chart Chat Live--Round 33: Watch as Jeffrey Shaffer, Steve Wexler, Andy Cotgreave, and Amanda Makulec debate the good, bad, and "scaredy-cats" of data visualization.
-
Data + Diversity: Making Data Visualizations More Accessible: Tableau Visionary HOF and accessibility advocate, Chris DeMartini will share ways to make your data visualizations more accessible from the start of your project and why it’s important to continue to push for accessibly within the data community. Plus, we'll be spending some time getting to know Community Equity Taskforce Member, Nai Louza.
-
Data Analytics Careers Summit: Discovering Your Path Forward: Join for a unique opportunity to learn how to break into & move up in the data analytics field.
- Stay up to date with the latest and greatest from the Tableau Community. We'll help you along in your Tableau journey, bring your data skills to the next level, and nurture powerful connections.
- Sign up to be a panelist for the 3charts@3 Live: A Mystery Chart Show featuring topics like personal finance, energy, healthcare and more!
- Data Book Club, Summer 2022 Selection: Invisible Women: Data Bias in a World Designed for Men
Vizzes
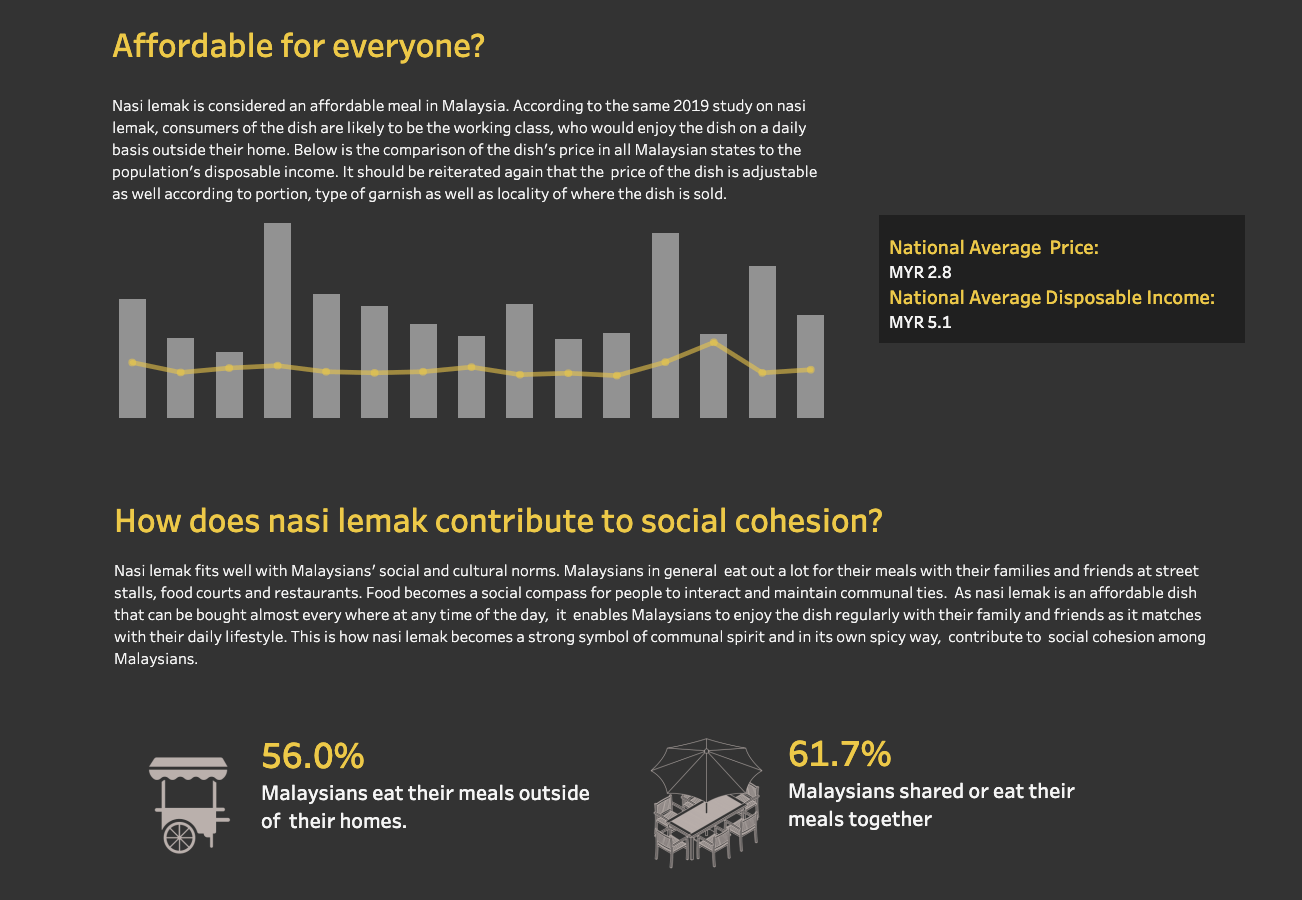
Shazeera Ahmad Zawawi: Nasi Lemak - The dish that unites the nation
See the latest Viz of the Day, trending vizzes, featured authors, and more on Tableau Public.
Check out some inspirational vizzes created by the community:
- Luke Abraham: Parameters: Build the Perfect View | #B2VB Parameters
- Pawan Sachdeva: Military Spending
- Marius Nikiforovas: Record-breaking inflation | OECD data
- Rebecca Finlay: Spotify Yearly Profit
- Tamás Varga: Military Expenditure 1988-2021
- Shazeera Ahmad Zawawi: Nasi Lemak - The dish that unites the nation
Community Projects
Back 2 Viz Basics
A bi-weekly project helping those who are newer in the community and just starting out with Tableau. Not limited just to newbies!
Web: Back 2 Viz Basics
Twitter: #B2VB
Week 18: Use a Parameter
Workout Wednesday
Build your skills with a weekly challenge to re-create an interactive data visualization.
Web: Workout Wednesday
Twitter: #WOW2022
Week 35: Conditional Table Formatting with Dynamic Headers
Preppin' Data
A weekly challenge to help you learn to prepare data and use Tableau Prep.
Web: Preppin’ Data
Twitter: #PreppinData
Week 35: C&BSCo Summary Stats
DataFam Con
A monthly challenge covering pop culture and fandoms.
Web: DataFam Con
Twitter: #DataFamCon
September 2022: Lord of the Rings
EduVizzers
A monthly project connecting real education data with real people.
Web: Eduvizzers
September 2022: Detailed Years of School Completed by People 25 Years and Over by Sex, Age Groups, Race and Hispanic Origin: 2021
Games Night Viz
A monthly project focusing on using data from your favorite games.
Web: Games Nights Viz
Twitter: #GamesNightViz
August 2022: The Tour: The Sound of Games with #DataPlusMusic
Iron Quest
Practice data sourcing, preparation, and visualization skills in a themed monthly challenge.
Web: Iron Quest
Twitter: #IronQuest
August 2022: The Tour: The Sound of Games with #DataPlusMusic
Public Policy Viz
Bridging the gap between analytics professionals and policy practitioners.
Web: Public Policy Viz
Twitter: #PublicPolicyViz
Project 1: Redlining in Pittsburgh, PA
Data Plus Music
A monthly project visualizing the data behind the music we love!
Web: Data Plus Music
Twitter: #DataPlusMusic
July 2022: The Intro
Storytelling with Data
Practice data visualization and storytelling skills by participating in monthly challenges and exercises.
Web: Storytelling with Data
Twitter: #SWDChallenge
September 2022: known to novel
Project Health Viz
Uncover new stories by visualizing healthcare data sets provided each month.
Web: Project Health Viz
Twitter: #ProjectHealthViz
August 2022: Mental Health Care Professionals Shortages
Diversity in Data
An initiative centered around diversity, equity & awareness by visualizing provided datasets each month.
Web: Diversity in Data
Twitter: #DiversityinData
September 2022: Global Women
Sports Viz Sunday
Create and share data visualizations using rich, sports-themed data sets in a monthly challenge.
Web: Sports Viz Sunday
Twitter: #SportsVizSunday
August 2022: Commonwealth Games
Viz for Social Good
Volunteer to design data visualizations that help nonprofits harness the power of data for social change.
Web: Viz for Social Good
Twitter: #VizforSocialGood
Sept 2-Sept 30 2022: India Water Portal/Arghyam
Real World Fake Data
Create business dashboards using provided data sets for various industries and departments.
Web: Real World Fake Data
Twitter: #RWFD
Session 3: Community Service Requests
SDG Viz Project
Visualize data about Sustainable Development Goals provided by the World Health Organization.
Web: SDG Viz Project
Twitter: #TheSDGVizProject
Zugehörige Storys

DataFam Roundup: April 8–12, 2024
 12 April, 2024
DataFam Roundup: April 1–5, 2024
5 April, 2024
DataFam Roundup: March 25–29, 2024
29 März, 2024
Blog abonnieren
Rufen Sie die neuesten Tableau-Updates in Ihrem Posteingang ab.