U.S. Public Sector Veterans Day Viz Challenge Results


In the weeks leading up to Tableau Conference, the public sector user community came together to help veterans better understand their benefits and educational options through the GI Bill program. The viz challenge culminated with a live event on Veterans Day where five finalists presented their innovative visualizations and one winner was crowned.
Tableau’s Head of Public Sector, Brig. Gen (Ret) Steven J. Spano, kicked off the event with remarks commemorating Veterans Day by saying, “Our veterans are the anchor of what our nation is all about, and today we honor them. We honor them for their sacrifices. And veterans’ families sacrifice almost as much. They may not go to battle or deploy in harm’s way, but they are sacrificing in so many ways.”
Special guest, veteran, and former Under Secretary for Benefits, Veterans Benefits Administration, U.S. Department of Veterans Affairs, Dr. Paul Lawrence shared inspirational remarks with the audience. Dr. Lawrence said, “Thank you to Tableau for hosting this challenge on such an important subject, on such an important day. America honors veterans in many different ways. One of them is a series of benefits that are available to those that earn them - disability compensation, pension, home loan guarantee, the GI Bill and so many more with well over $100 billion dollars of benefits every year going to our veterans.”
Dr. Lawrence closed his remarks focusing on education for veterans by saying, “I am of the personal belief that we entrust service members at very young ages with a tremendous amount of resources, life or death decisions, and yet we want to constrain their decisions about where they get their education once they get out [of the military]. I would ask you to figure out what information do they need to make the most informed choice as possible, and let them make those choices. I believe that military service should accelerate a veteran’s pursuit of the American dream.”
See the submissions, finalists, and winning data visualization below.
Finalists


Washington, District of Columbia, United States
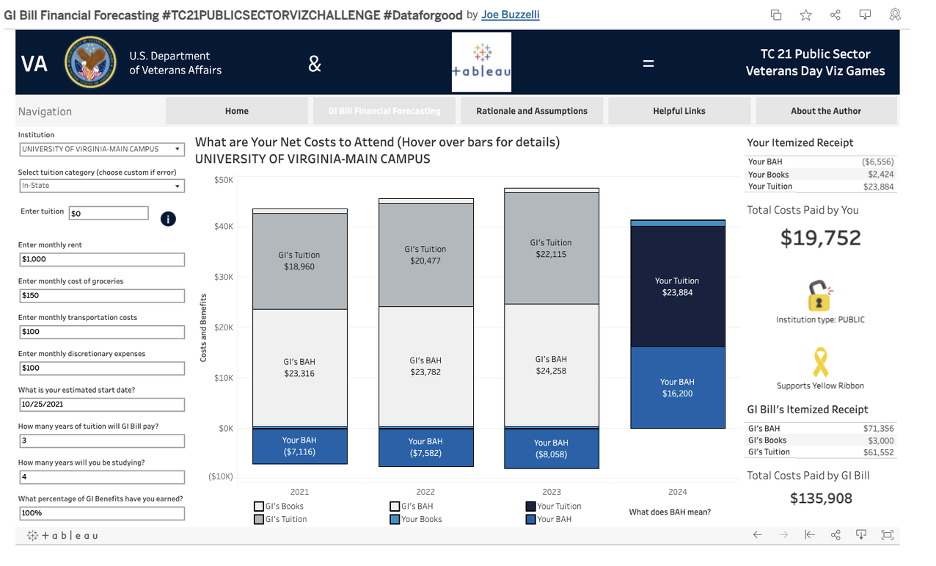
Joe Buzzelli, Data Science Senior Consultant, Guidehouse
The GI Bill Financial Forecasting Tool focused on what a GI Beneficiary would have to pay after their benefits. The user can select the school they are interested in and if the tuition is available in the data, it auto populates. If it is not, the user can enter the tuition themselves. Additionally, the user can enter their living expenses and GI benefits. From there, the tool forecasts what must be paid and when the payments will be due (by year). Interact with Joe’s viz here.
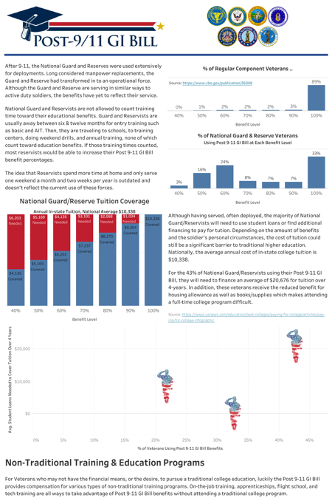
Geri Schmidt, Sales Operations Manager, HCL Software
The role of the National Guard and Reserves has changed, it's no longer one weekend a month and two weeks a year, they are now an operational force. As an operational force, soldiers in the Guard and Reserve are spending significant amounts of time away from their family in training. However, unlike their active duty counterparts, the additional months and years spent training does not count toward their Post 9-11 GI bill benefits. Whether a veteran has reduced benefits or wants to pursue education outside of a traditional college program, the Post 9-11 GI Bill offers options for non-college training. This visualization helps National Guard and Reservists understand their non-traditional training options. View Geri's viz here.
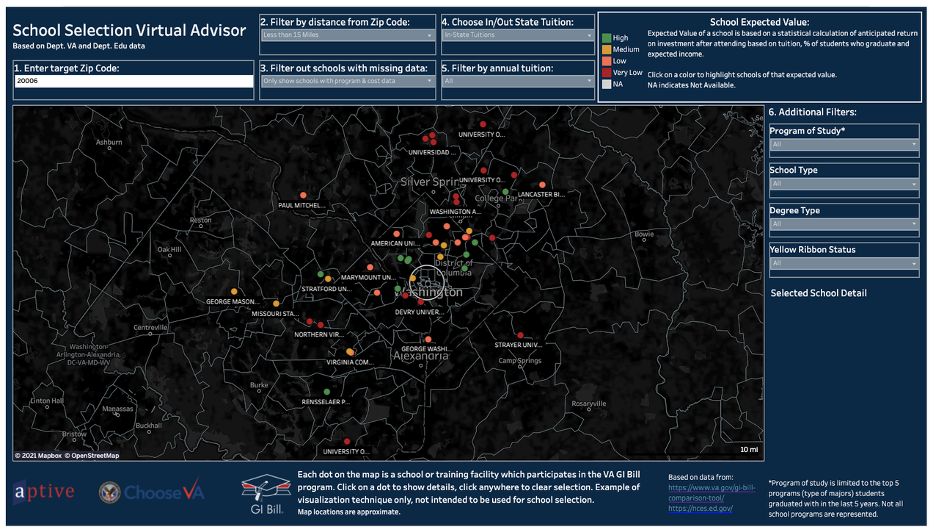
Alex Mikuliak, Ben Kundsen, and Jason Lee, Aptive Resources
This viz is meant to be a virtual advisor with some local knowledge – which includes a distance calculation. The team created a tool which would help narrow the field of schools being considered instead of getting very detailed in selecting only one. The included “Expected Value” calculation aimed to provide a single metric which represented the cost, expected salary and graduation rate. Interact with Team Aptive’s viz here.
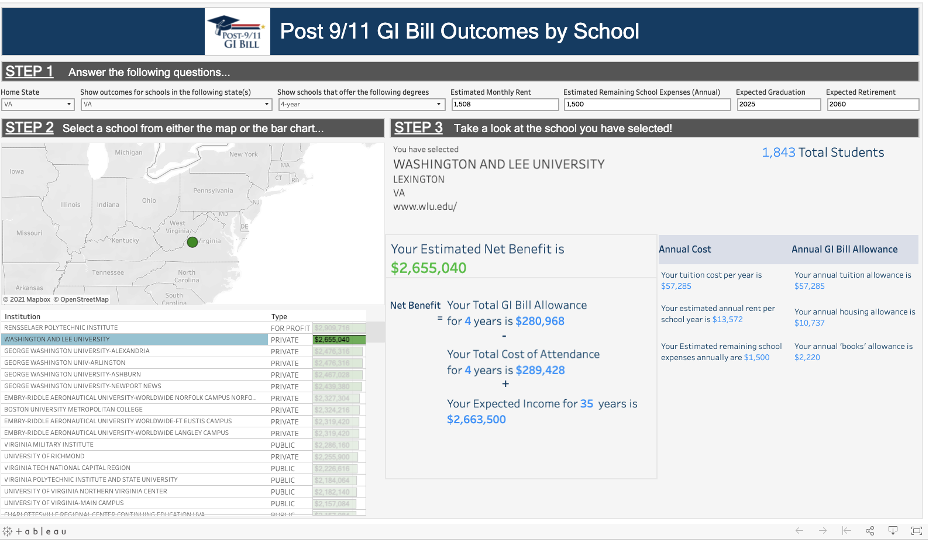
Belmir Smajic, Data Consultant at UDig
This viz focuses on the financial outcomes by school. The viz asks for some user input and then gives the user a “net benefit amount”. The benefit is calculated using total working years, expected income by school, and GI Bill award by school to give you a final dollar amount benefit, which can then be used to compare different schools. Check out Belmir’s viz here.
Veterans Day Viz Challenge Champion
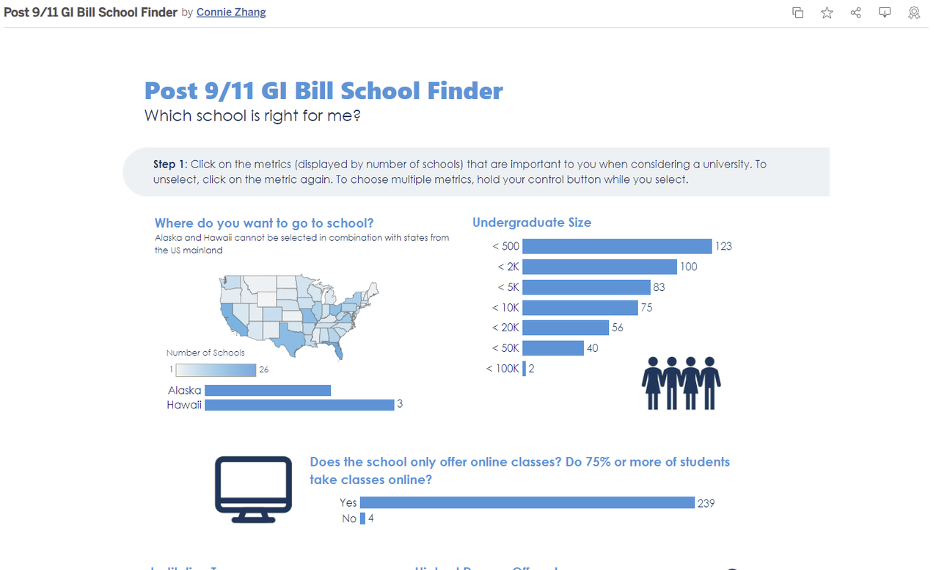
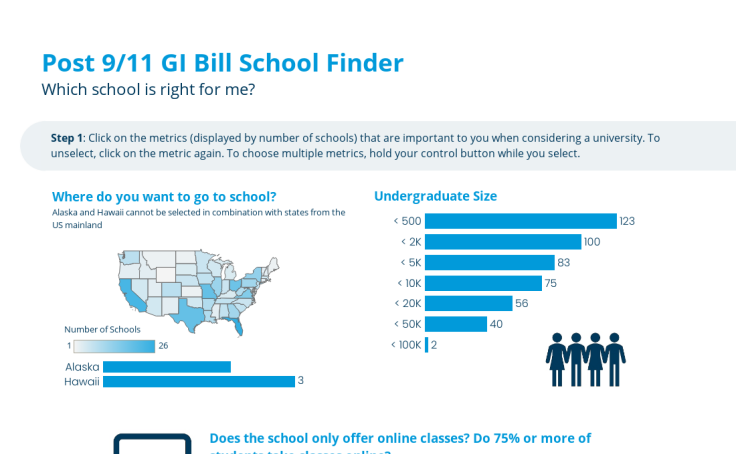
Connie Zhang, Founder & CEO, JackTech LLC
Deciding where to go for college can be overwhelming because there are so many different universities to choose from. This dashboard can help veterans narrow down their list of potential options to make their school search more manageable in three easy steps. The first step includes selecting certain logistical metrics that are of importance; the second step includes a scatter plot which examines critical, return-on-investment factors about the schools that match the required criteria from step one, and the final step includes exploring lifestyle information on the schools displayed in step two. Visit Connie’s winning viz here.
View all of the challenge submissions here or below.


Zugehörige Storys

Meet Iron Viz 2024 Finalist Jessica Moon
 15 April, 2024

Meet Iron Viz 2024 Finalist Pata Gogová
8 April, 2024

Student to BI Analyst, How Tableau Can Lead to a Successful Data Career
 20 März, 2024
Blog abonnieren
Rufen Sie die neuesten Tableau-Updates in Ihrem Posteingang ab.