64 to 1: Matchup Guide to March Madness


Editor's note: Jay Lewis works in finance and runs the March Madness website 64to1.com
Let's start with some good news
Your odds of filling out a perfect NCAA bracket are far better than 1 in 9.2 quintillion. This dubious metric, cited each year in certain corners of news media, is 2 raised to the 63rd power, a computation that assumes we're either picking winners at random or that every game is as evenly matched as a coin flip. In practice, each pick is more like a loaded coin where we start with some basic information about the weighting. A game like Xavier-vs-Maryland is close to 50/50 whereas 1-seed Gonzaga could beat 16-seed South Dakota State 98% of the time. By leveraging probabilities, the odds of a perfect bracket increase dramatically, maybe even as high as 1 in 2 billion, FiveThirtyEight's recent estimate. That's only 8 times worse than the odds of nailing all the Powerball numbers!
These long odds may sound intimidating, but even a deeply flawed bracket can win a pool if you get a few key games right, especially in the later rounds where correct picks are worth many times more points than in early rounds. Most pools don't lock picks until Thursday morning, so there's still time for exploratory data analysis and bracket tweaking. To that end, I've posted a Tableau Public viz designed to help you carve through pick frequency trends, win probabilities, rosters, gamelogs, and team performance metrics. Analysis and process writeup follow below the viz.
There's a large volume of data to sift through in basketball analysis, so let's start with a rundown of what we have. In most cases I used python scripts to scrape all the raw data.
Seeds
While it's true that seeding generally aligns with strength, it's worth treating seeds with some skepticism in light of well-documented flaws in the selection committee's seeding process. The committee relies on RPI, an older metric that evaluates win percentage and strength of schedule. RPI ignores margin of victory, which means it assigns the same value to a 1-pt win as it does to a 40-pt win.
Some of the more modern ranking systems developed by analysts like Ken Pomeroy and Dean Oliver (creator of ESPN's BPI rankings and author of the book, Basketball on Paper) use margin of victory and tempo-weighted statistics. This difference highlights glaring seeding errors like Wichita State, which received a 10 seed from the committee despite both Pomeroy and BPI ranking them in the top 15 overall. A team like Kansas, on the other hand, racked up an impressive win percentage with a long string of narrow victories, so the more advanced ranking models put Kansas around 10th overall despite their 1 seed.
I'm also skeptical of broadly held beliefs about certain numbers like the curse of the 5 seeds. While it's true that 12s in aggregate do well for a lower seed, picking reflexively against 5s can lead to some big misses like when Michigan St and Butler met in the Final Four as 5 seeds in 2010. The reality of 12-5 is that it's typically a 70-30 type of game, so you can expect for the favored team to lose roughly 1 in 4 times. That doesn't mean it's always the right play to pick a 12 every year.
Win Probability
There are a few ways to get to win probability estimates, the easiest of which is to just leverage FiveThirtyEight's model, which is an aggregation of several ranking systems. For the Team Profiles dashboard, I built out a custom system in Alteryx that startss with offensive and defensive efficiency for each game, and then I adjusted those values for strength of the opponent and date played (later games are weighted more heavily). From those values, I calculated an approximate win percentage for each team relative to a statistically average D1 opponent, and I plugged that value into the Bill James formula, Log5, for the head-to-head win probability estimates. Gamelog data for these calculations comes from sports-reference.com.
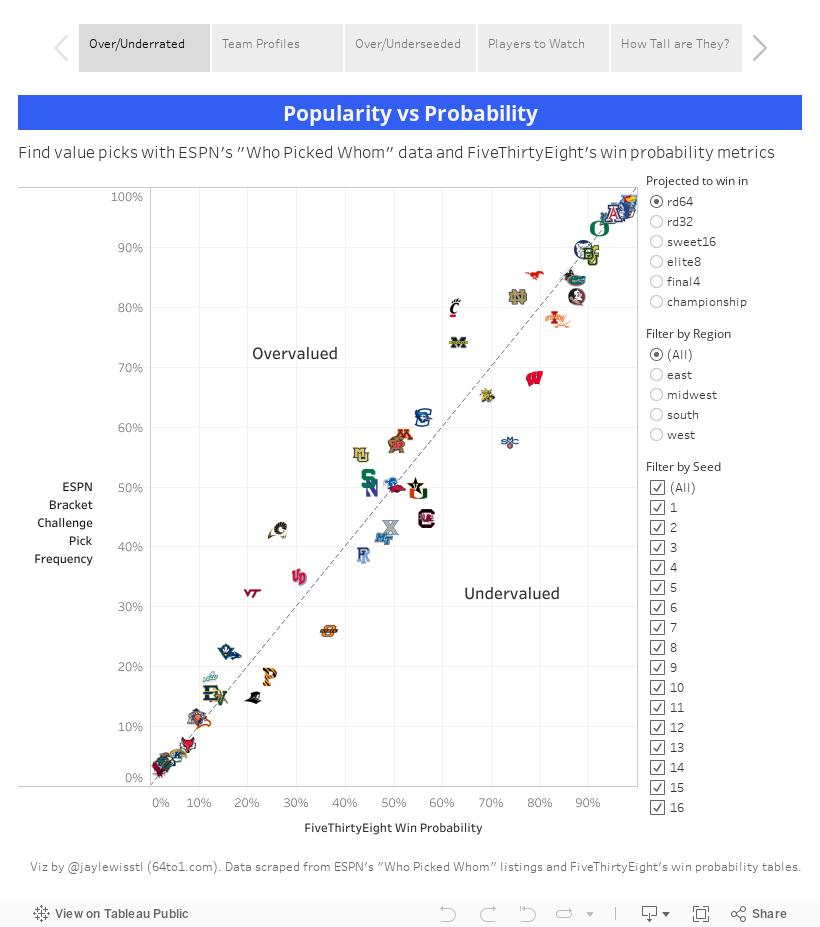
Pick Frequencies
The ESPN Who Picked Whom data from their tournament challenge site is by far the best source for finding where herd mentalities are forming. This data can show you that people are about twice as likely to pick a 1 seed over a 2 to advance to the final four despite the relative parity between most of the 1-2 pairings this year. I like frequency data because it shows the opportunity picks - strong teams with a high chance of winning who are undervalued.
Z-Scores of Team Performance Metrics
Standard deviations above or below the D1 average can offer some key clues for where teams have strengths and vulnerabilities, and it provides a helpful overview of playing style. For example, we know the 2010 and 2013 Georgetown teams who lost in major upsets struggled all year with turnovers. This tendency was present in a z-score of their turnover rate. Baylor is a high seed this year with a high turnover rate.
Gamelog Trend and Rosters
Some teams come into the tournament with a head of steam, while others may limp down the stretch due to key injuries. This pattern can offer indications of future performance. It's also possible that a team with high reliance on freshmen like Kentucky may improve over the course of the season as young players grow and adapt to a system.
Building the Visualization
For more complex work, I'm a fan of doing a rough sketch of a visualization on paper, even if it's just a 5-minute scribble effort, before I start putting things together in Tableau. It helps me think through the necessary data structure earlier in the process. I've found this is a common and useful practice among Tableau users and in the broader data visualization community. From that initial sketch, I knew I wanted a profile dashboard with the ability to drill down on multiple dimensions for each team. To get all the dimensions I wanted, I needed rows of data covering each team in the tournament (68), gamelogs (35 per team), rosters (10 per team), head-to-head win probabilities in region (15), and z-scored performance metrics (12). Join it all up and 68*35*10*15*12 is a 4.3 million row extract. Fortunately Tableau Public just expanded their row limit to 10 million, so I had plenty of room to spare.
Good luck with your bracket!
Zugehörige Storys

Meet Iron Viz 2024 Finalist Jessica Moon
 15 April, 2024

Meet Iron Viz 2024 Finalist Pata Gogová
8 April, 2024

Student to BI Analyst, How Tableau Can Lead to a Successful Data Career
 20 März, 2024
Blog abonnieren
Rufen Sie die neuesten Tableau-Updates in Ihrem Posteingang ab.