Announcing the Winners of the Student Viz Assignment Contest!


Here at Tableau, we're proud to support instructors and students around the world who are using our products in the classroom to see and understand their data. Through our Academic Programs, instructors can get free Tableau Desktop licenses for the students in their courses and labs, and students at accredited universities can get a year-long license that's renewable as long as they're enrolled full-time.
We also see students using Tableau Public, our data-sharing platform that's free for everyone, to share some pretty amazing homework assignments with the world and to build an online portfolio of their work that they can share with prospective employers. It's a great way to join a growing community of data enthusiasts and to continue along the learning curve long after finals week is over.
That's why we decided to run our very first Student Viz Assignment Contest. Starting in September, students could submit their favorite homework assignment along with details of their school using our online form. We were delighted to receive over 100 submissions, and without further ado, here are the winners:
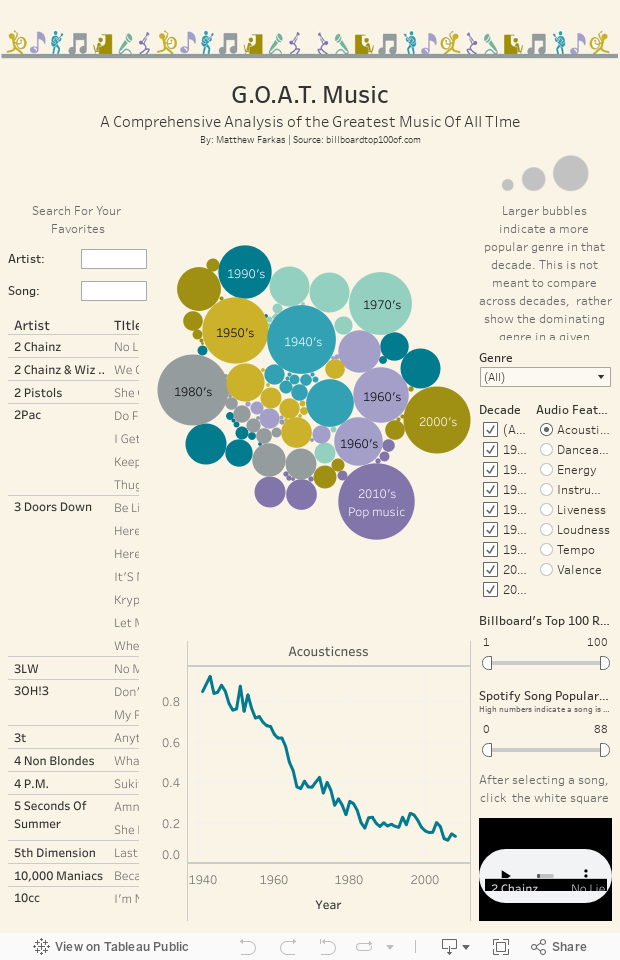
First Place: Matthew Farkas, Northwestern University - G.O.A.T Music
Matthew has created a fun and easy way to explore over 5,800 songs recorded over eight decades of music history. Using the packed bubble as a filter, you can find and listen to the most popular songs from each genre according to the Billboard Top 100 list. This viz employs excellent use of filters, helpful annotations to orient the reader, and superb layout.
Second Place: Harpreet Ghuman, University of Maryland, College Park - The Cocktail Guide V2.0
Harpreet has taken an entire cocktail recipe book and distilled it into a single viz, making use of the sigmoid function to link types with drinks with ingredients and instructions on how to prepare them. As a final touch of genius, Harpreet included a custom shape for each of the 77 cocktails that shows the recipe as well as the type of glass to serve it in. Bravo, Harpreet!

Third Place: Nathan Flanagan, Brigham Young University (Provo) - Injuries in the US
Nathan has taken a creative approach to allow his audience to explore how people in the US injure various parts of their bodies. Clicking on the image brings up a bar chart showing how that part of the body is most commonly injured, and hovering over the bars reveals a histogram showing the breakdown by age. This design allows the reader to explore the topic in layers, as opposed to showing everything at once.

Honorable Mentions
- Walter Allen, University of Washington - 15 Years of Moneyball
- Lauri Nurmela, Aalto University - Helsinki Traffic Accidents, 2010-2014
- Sang-Wha Sien, University of Washington - Travel Helper
- Rishagh Dimri, Oklahoma State University - America's Problem of Public Mass Shootings
Please join us in congratulating these winners and honorable mention recipients by sharing a link to this announcement blog post on your favorite social media platform. On top of the internet fame they have already acquired for themselves as a result of their amazing work, our three winners will also receive a swag package in the mail in the coming days. Congrats to each of you!
As exciting as it was for our team to see and judge all of these amazing projects, we're even more excited that we're running a second iteration of this contest again for the winter and spring terms! Starting on January 17, just use the form on the Student Viz Assignment Contest page to submit your homework assignment on or before May 16, 2017, and you could be next winner!
Zugehörige Storys

Meet Iron Viz 2024 Finalist Jessica Moon
 15 April, 2024

Meet Iron Viz 2024 Finalist Pata Gogová
8 April, 2024

Student to BI Analyst, How Tableau Can Lead to a Successful Data Career
 20 März, 2024
Blog abonnieren
Rufen Sie die neuesten Tableau-Updates in Ihrem Posteingang ab.