Best of the Tableau Web: Reflections on racial injustice and Iron Viz updates
Hello, Tableau community! Welcome to Andy's June round-up of the best content being produced by you, the Tableau community.


Hello Tableau enthusiasts. Welcome to another roundup of Tableau community highlights from the month of June.
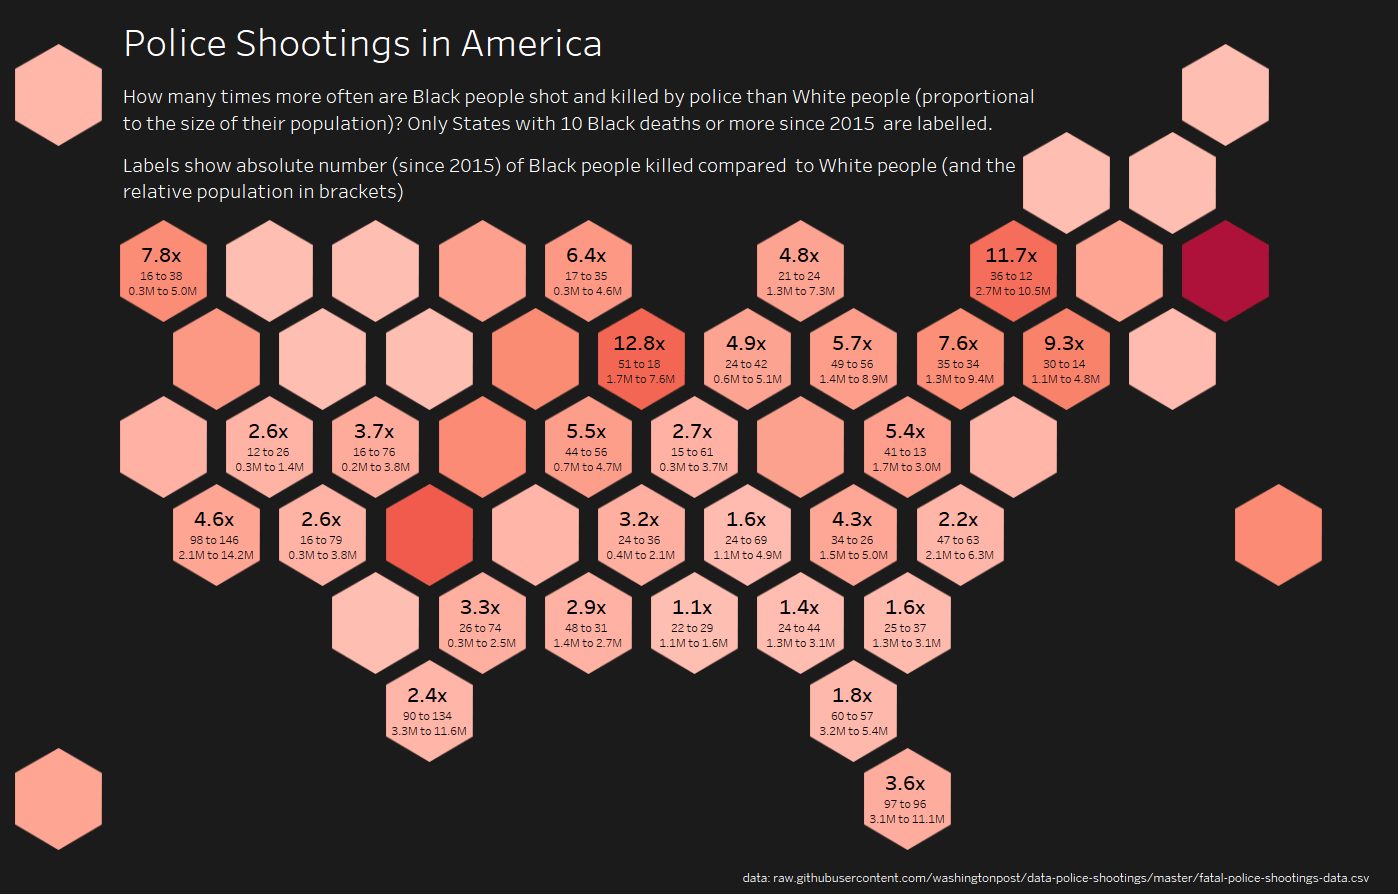
News of the murders of George Floyd, Breonna Taylor, Manuel Ellis is a reminder of injustices and violence that Black Americans face in the United States. It was heartening to see the Tableau Community respond, using data as a mechanism to help understand racism and race-based violence. Tim Ngwena of the Information Lab in the UK, gave an honest and informative video of his views on race. Chris Love shared his path to educating himself on racial injustice through the lens of data. Candra McRae and Bridget Cogley collaborated on a piece in time for Juneteenth. Bridget wrote a post on the way data reflects life, and how we’re too often presented with data without taking the time to honor what it stands for. Beyond blogs, I’ve had the chance to explore some eye-opening visualizations on Tableau Public. If you take one look at the June’s Viz of the Day, you’ll see how powerful data can be to explore or tell the stories of racism in our societies.

Speaking of powerful data, we recently announced the Iron Viz feeder competition, focusing on health and wellness. Whether you are a seasoned pro, or new to Tableau, Iron Viz is an amazing way to develop your skills and get involved in our community. If you want to learn more, check out posts by past winners and finalists from Sarah Bartlett, Lindsay Poulter, and Joshua Smith. Check out the details of this year’s feeder. I look forward to seeing your entries.
As always, I hope you enjoy the list! Follow me on Twitter and LinkedIn as I share these highlights and other resources throughout the month. Also, check out which blogs I am following here. If you don’t see yours on the list, you can add it here.
Tips and tricks
jim Dehner FAQ Series - Duration and Time - Not the same thing
Sindhu Paineeru How to create Pareto Chart in Tableau
Erica Hughes TOTAL( ) vs WINDOW_SUM( )
Mark Edwards Getting Animated Part 3 : Scatter Plots
Janasobini Vetharuban Using the Show/Hide container button as a way to prompt users for additional data
Amy Tran 6 Simple Ways to Enhance your Tableau Map
Alex Ross Twitter WDC 2.0
Micol Bedarida Dimensions and Measures in Tableau – what they are and how to use them
Gordon Hack Diverging Bar Chart With ‘Dynamic’ Fixed Axis
Lorna Brown #TableauTipTuesday 2020 Week 25: How to use Set Controls
Ryan Sleeper How to Do Pagination in Tableau
InterWorks PYD104 – Tableau’s 2020.2 Features
Marc Reid Creating a Chord Diagram with Tableau Prep and Desktop
Erica Hughes Outer and Inner Padding in Tableau Dashboards
Inspiration
Lindsay Betzendahl Utilizing Gestalt Principles to Improve Your Data Visualization Design
Ken Flerlage 10 Design Tips & Tricks for Better Dataviz Storytelling (Guest Post)
Kevin Flerlage Make a Chart Out of Any Image Without Illustrator or Any Math!
Bridget Cogley Data as Testimony
Sean Gu The Seven Deadly Sins of Tableau Visualisation
Neil Richards How do you create 31 visualisations in a month?
Tim Ngwena My views on Race
Chris Love Exploring #BlackLivesMatter in 5 Charts
Set and parameter actions
Ryan Sleeper Tableau Tip: Single Row Drilldown “Deluxe”
Rosario Gauna Highlight/Unhighlight an Entire Table Row in Tableau
Calculations
Rosario Gauna What is the distribution of total orders by customer?
Luke Donovan How to build a Slope Graph using rank
Iron Viz
Lindsey Poulter The Process Behind Building a Winning Iron Viz Feeder Dashboard
Sarah Bartlett Iron Quest – Quantified Self Recap
Joshua Smith Get your [IronViz!] story straight!
Chris Love IronViz 2020
Zugehörige Storys

Meet Iron Viz 2024 Finalist Jessica Moon
 15 April, 2024

DataFam Roundup: April 8–12, 2024
 12 April, 2024

Meet Iron Viz 2024 Finalist Pata Gogová
8 April, 2024
Blog abonnieren
Rufen Sie die neuesten Tableau-Updates in Ihrem Posteingang ab.