Five TC sessions to improve your marketing analytics


Whether kicking off campaigns, launching new ads, or finding ways to capture more leads, you’re likely on the hunt for the next big marketing idea—or at least the next big idea to improve performance. At Tableau Conference, we had over a dozen sessions where countless insights and valuable lessons on innovative marketing analytics best practices were shared. While the hundreds of conference sessions are available to you on-demand on the TC website, we’ve done the work of finding helpful and relevant marketing-related content for you. Here are recaps of a few of these sessions from customers like GoDaddy, Lending Tree, FICO, among others, and from us at Tableau, sharing the recording and highlighting ideas you’ll want to replicate at your own company.
Alerts for digital and product marketing analytics
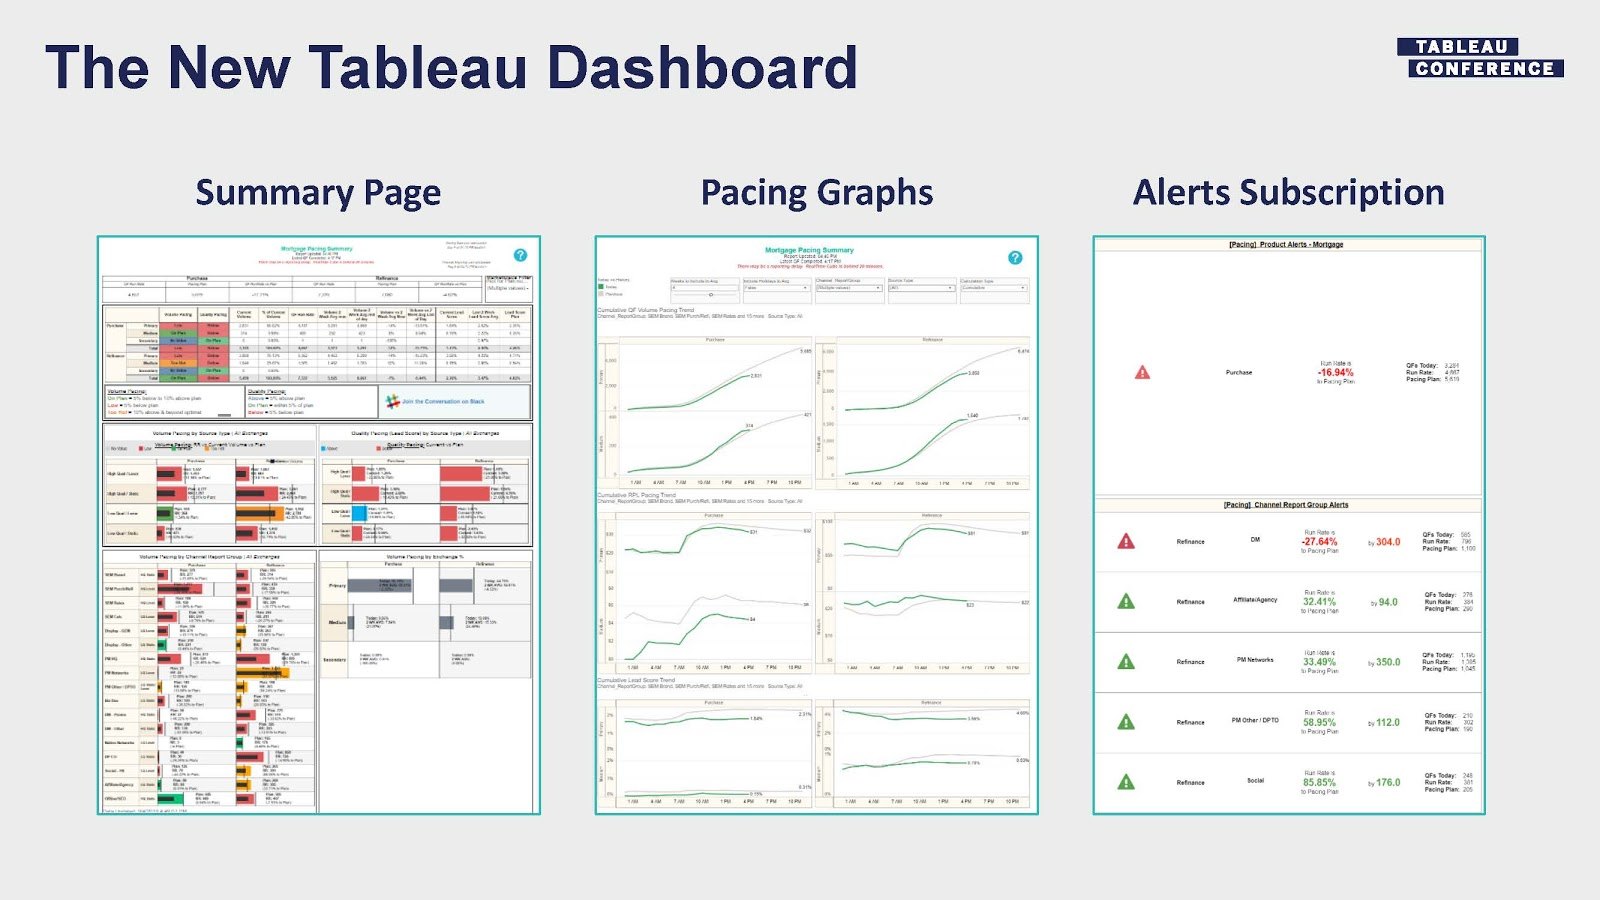
To make the most of Lending Tree digital marketing and product data, Jacob Vann, Director of Reporting & Analytics, and Abby Kuang, Senior Analyst of Reporting & Analytics, shared how they empowered teams to reach their goals and apply insights for timely decision-making. In their detailed and engaging session, “Lending Tree: Enabling Near Real Time Alerts for Digital Marketing and Product Analytics,” attendees learned about how they focused on the business problem to define key metrics for mortgage-pacing KPIs and to better classify leads. Their mortgage-pacing dashboard presents data in a simple way to focus viewers on performance by effectively using color and consistent documentation. Taking people through the team organization and how they’ve structured their data, Abby and John demonstrated how they’ve enabled alerting through OpsGenie and Slack to keep people on track with hitting their goals. They have also seen this alerting used on their sales analytics, web optimization, manufacturing and call center teams.
Understand customers and optimize engagement
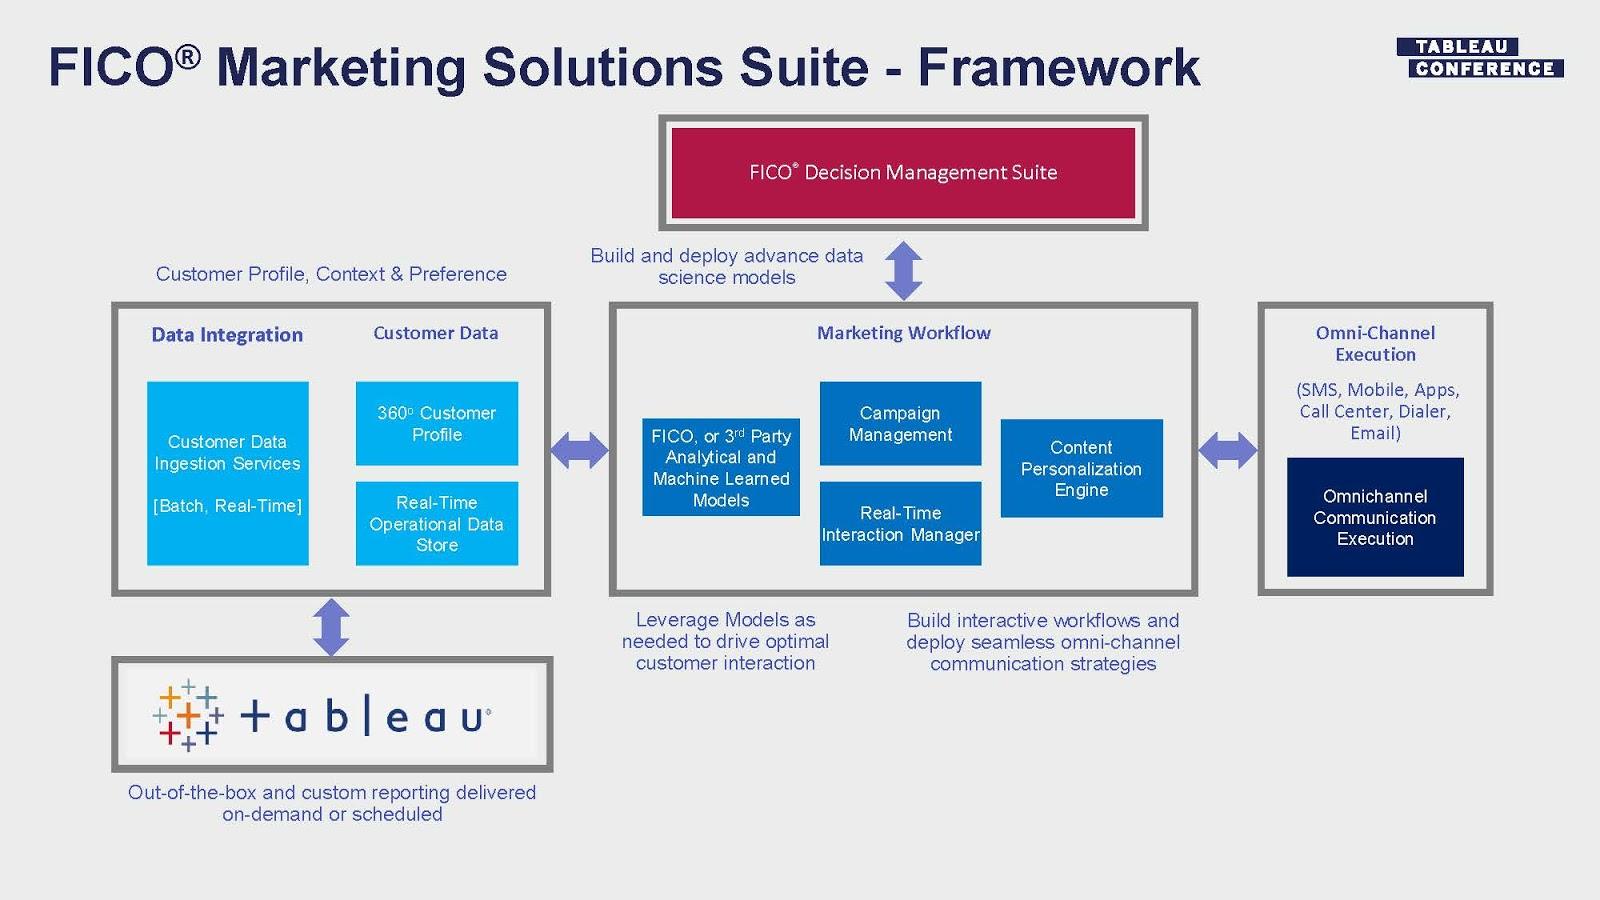
Director Product Management, Manish Pathak, and Director of the Marketing Solutions Measurement and Analysis, Amy Esselman, presented on ways they help their stakeholders on FICO Marketing Solutions Suite team improve customer engagement, optimize campaigns, accelerate sales, and more. In “FICO: Joining Forces with Tableau to Help Marketers Understand their Customers and Optimize Engagement,” both Manish and Amy tackled common barriers to having a complete understanding of customers like siloed marketing data, timely reporting, access to insights that enable better decision-making, and more.
As they said, “there is no shortage of data,” but they offered ways to take this marketing data and answer questions like:
- How do I measure customer success?
- How do I measure whether or not my marketing strategy is profitable or not?
- What combinations of channels are yielding me the best results?
Sharing the framework that their team uses to support their customers, Amy and Manish were able to serve their clients with self-service reporting, standard reporting packages, and interactive dashboards using the FICO Decision Management Suite and Tableau. As a result, they have been able to improve performance, reduce costs, and increase agility.
Insights from web analytics
Regardless of whether you support teams in digital marketing, marketing automation, or another marketing function, your work either directly or indirectly drives prospects and customers to a landing page to take action. Making this successful depends on more than just the experience on the single page—a result of multiple touchpoints and activities before page visitors arrive—but what a visitor does when they get to the landing page is telling.
As you are well aware, landing pages offer the opportunity to capture numerous data points that fill out the picture of a visitor, helping marketers understand what is working and what isn’t. This web analytics data can tell you what visitors are engaging with, how long they stay on the page, where they go next, and more. In addition to helping business partners measure and report on web analytics data, marketing analysts can help stakeholders define KPIs like conversion, help them optimize the performance of their campaigns/ads/social media content, among other tasks.
In two breakout sessions directly focused on web analytics—one by Amy Song from GoDaddy and one which was mine, you can learn how to create flexible, self-service analytics models, teaching your stakeholders to find actionable insights, regardless of their level of data literacy. Both Amy Song and I shared unique use cases in our respective sessions, but there were common themes on the need for data preparation, communication with stakeholders, and enabling the understanding of analytics—or data literacy—of your non-technical colleagues.
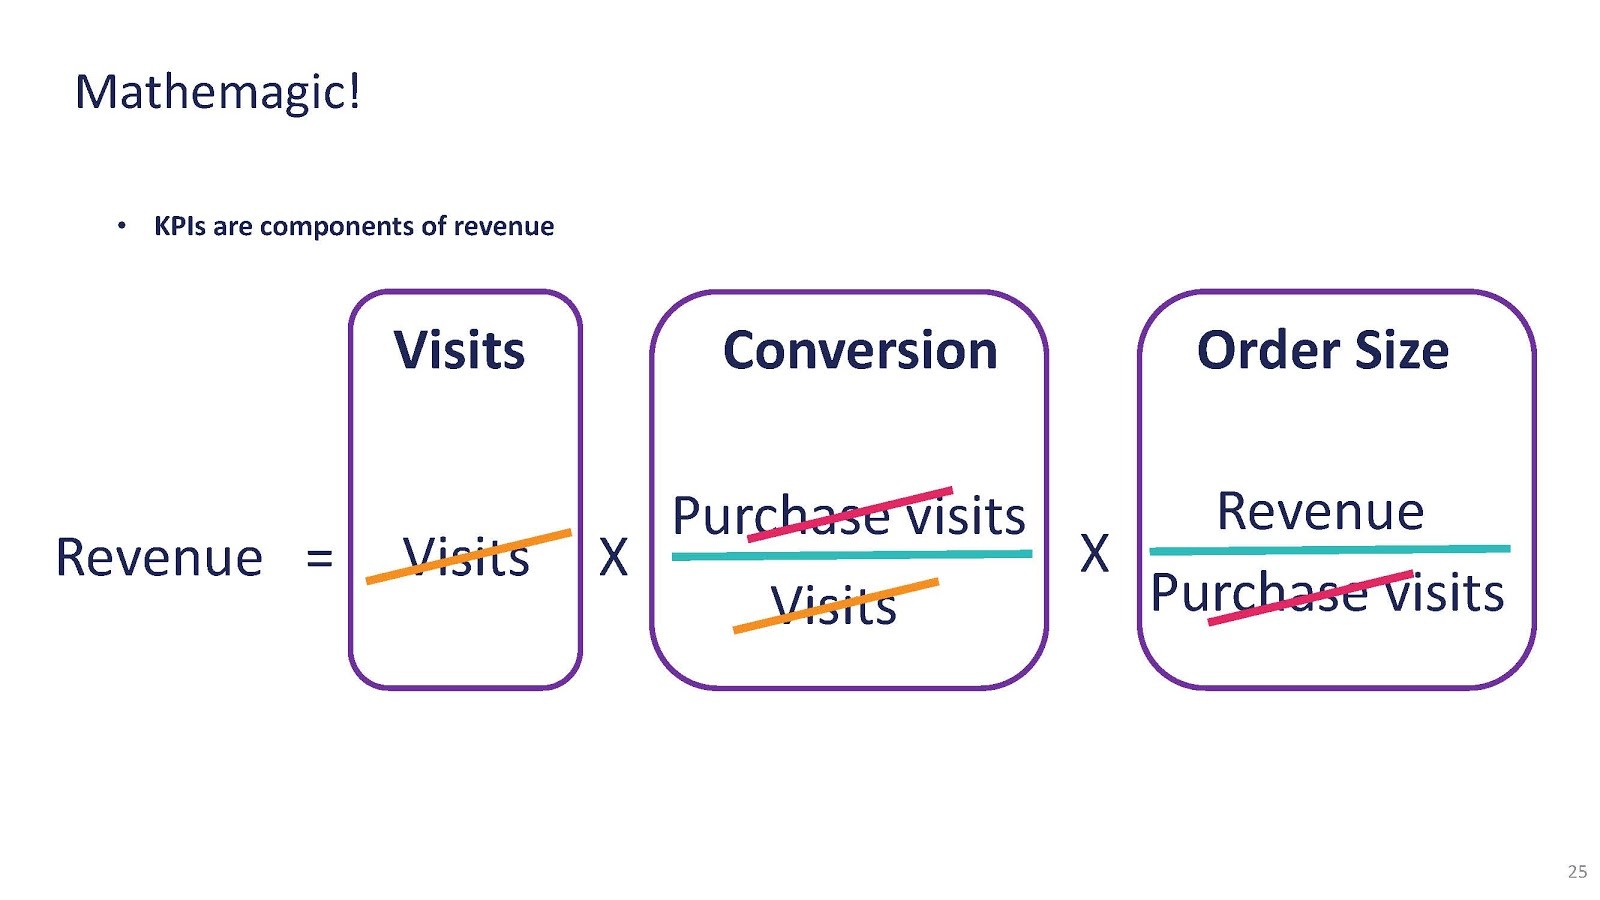
In their “GoDaddy Web Analytics Lessons Learned” session, Senior Manager of Web Analytics at GoDaddy, Amy Song, presented an engaging session focused on how to make analysis of marketing data meaningful, relevant, and applicable to your business strategy. Amy shared how the GoDaddy team successfully transitioned from a homegrown traffic analytics tool to Google Analytics (GA), ultimately enabling stakeholders to make data-driven decisions quickly. Beginning with three principles that Amy finds are at the core of self-service analytics environments, Amy took attendees through the GoDaddy analytics journey as an example for attendees to learn from, offering practical advice along the way. By addressing how to standardize metrics across departments, Amy broke down a marketing KPI into an easy-to-understand math equation, showing attendees how to make the equation their own. Check out Amy’s session for takeaways on how to enable stakeholders to view, access, and better understand data, grounded in the application of GA data to business strategy.

In my session, “How Tableau uses Google Analytics,” I offered up three use cases, demonstrating how we use GA to answer questions and the thought framework in which we approach website analytics, considering the balance between scale and effort when approaching reporting. As a Web Analytics Product Manager, I also discussed how I decide when to use the Google Analytics interface and when to use Tableau—like when I join data, create ongoing reporting, do in-depth analysis, etc.—showing attendees how to buy a Tableau data source with GA data using Google Big Query. In one use case, I discussed my methodology and practice of tracking changes to the TC19 website landing page, which improved the registration experience for visitors and the number of TC19 registrations.
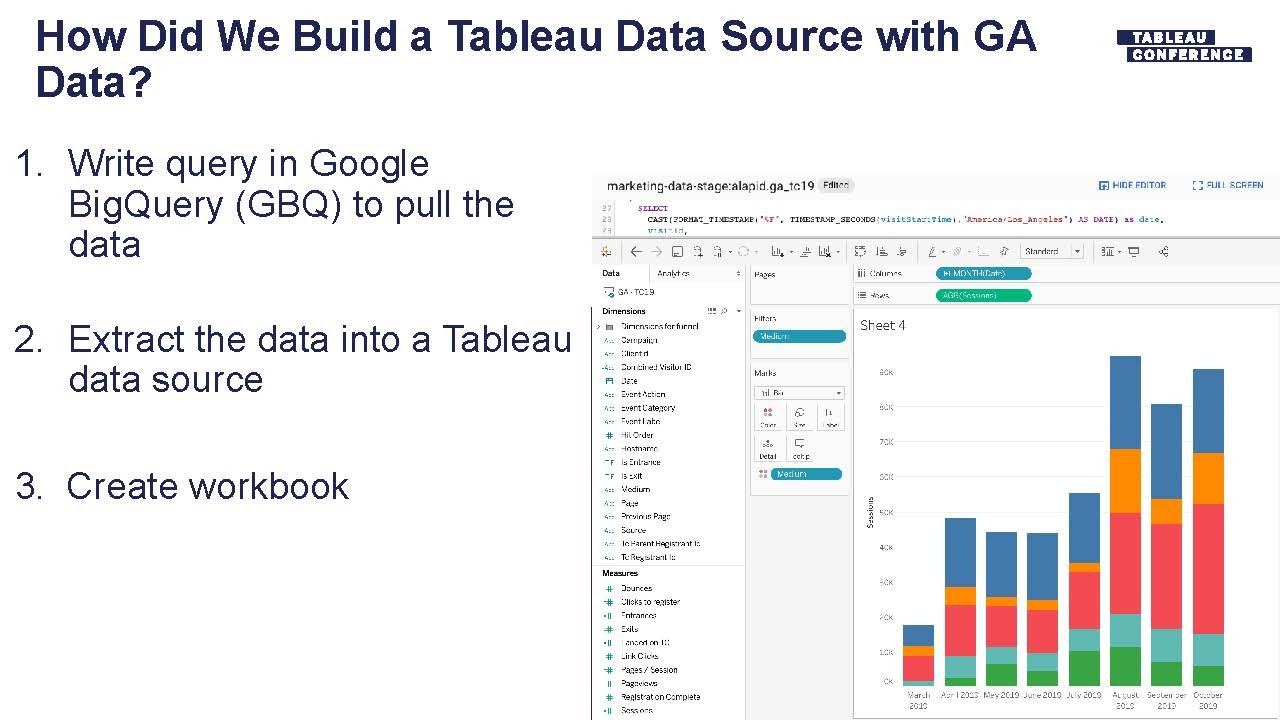
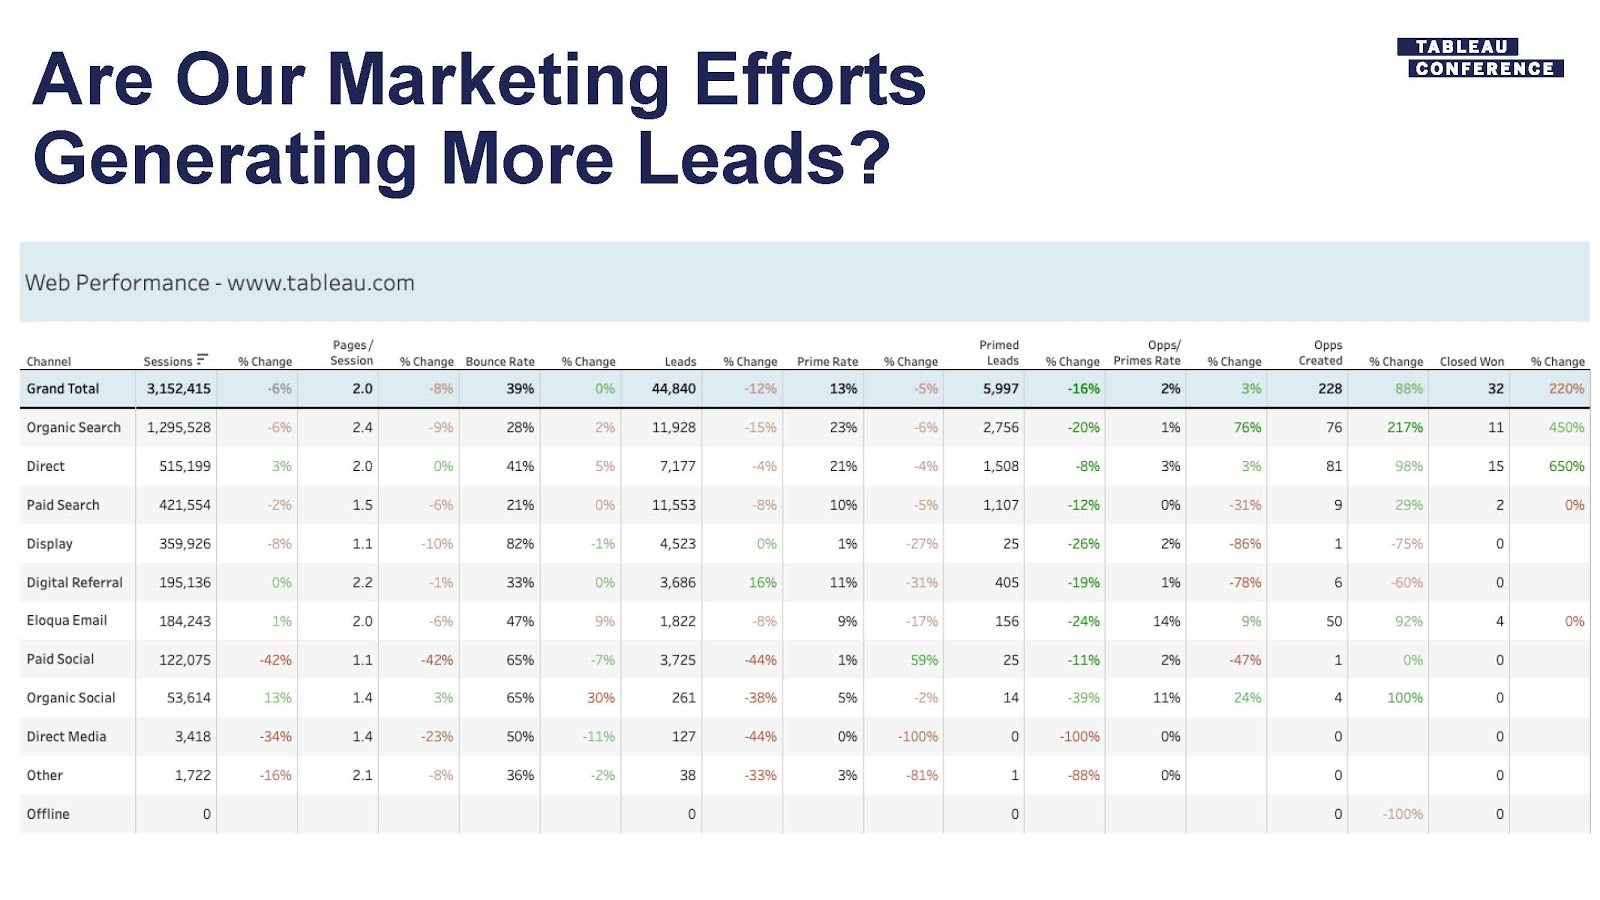
Next, I went through the process of bringing GA data into Tableau, demonstrating how I am able to easily answer business questions like, “Are our marketing efforts generating leads?” with greater depth. In my efforts to enable stakeholders to self-serve—and avoid being a bottleneck, I have plans for the future: continuing to audit and track, create a comprehensive data source, provide more documentation and training to those outside my team, as well as other projects.
Data storytelling with visualization
As Singlewire put it aptly: everything in marketing boils down to a data problem. At TC19, Director of Marketing at Singlewire, Brad Parkel, partnered with David McNamara, Product Marketing Manager at Trifacta, to show attendees how proactive decision-making comes from having access to and consuming data from as many channels as possible. This is especially true for the communication data Singlewire manages as an alert notification software company, since their system is critical to keeping people safe and informed. With large volumes of data from a variety of channels, there can be unique challenges to cleaning, formatting, preparing data, which is no different for something like marketing data.
In their “Using Data Wrangling to Tell the Marketing Story through Visual Analytics,” session, David and Brad shared examples of how to process marketing data from events, campaign performance, and more with Trifacta and Tableau to produce meaningful reporting without the need to hire data scientists or learn code. They demonstrated how they used Trifacta and Tableau to save 62 days every year by reducing reporting turnaround time from 8 hours to 30 minutes. With access to these actionable insights, the Singlewire marketing team is able to be agile and proactive with ease.
Apply the tips shared by marketing professionals at Tableau Conference to improve your own marketing campaigns, web analytics performance, and other goals. For more resources and inspiration for your marketing analytics and reporting, check out our Marketing Analytics solutions page.
Zugehörige Storys

How Team USA uses data to build a digital HQ
 8 Februar, 2022

Wichtige Datentrends für Sie in 2022
 3 Februar, 2022

Healthcare Analytics Hub Starter Kit: Get the data you need faster
 18 Oktober, 2019
The purpose of the Healthcare Analytics Hub Starter Kit is to provide a sample of what your healthcare app could look like. It’s not a complete solution; instead, it’s focused on what’s possible. Please contact your Tableau Account Manager to get started today!
Blog abonnieren
Rufen Sie die neuesten Tableau-Updates in Ihrem Posteingang ab.